Crypto Price Predictions for Today, September 25: Bitcoin (BTC), Ethereum (ETH), and Solana (SOL)


Bitcoin, Ethereum, and Solana have each spent days trading between clear price levels. That gives today’s market a question: which coin can break out of its range, and which one could lose support first?
Their indicator readings offer different clues, with Solana showing the strongest agreement across the 4 measures.
What you'll learn 👉
Bitcoin Price Is Near the Top of Its Recent Range
Bitcoin price has traded mainly between $82,900 and $85,000 since Wednesday afternoon. BTC is now around $84,200, closer to the upper boundary. That makes $85,000 the level to watch if buyers make another attempt to push higher.
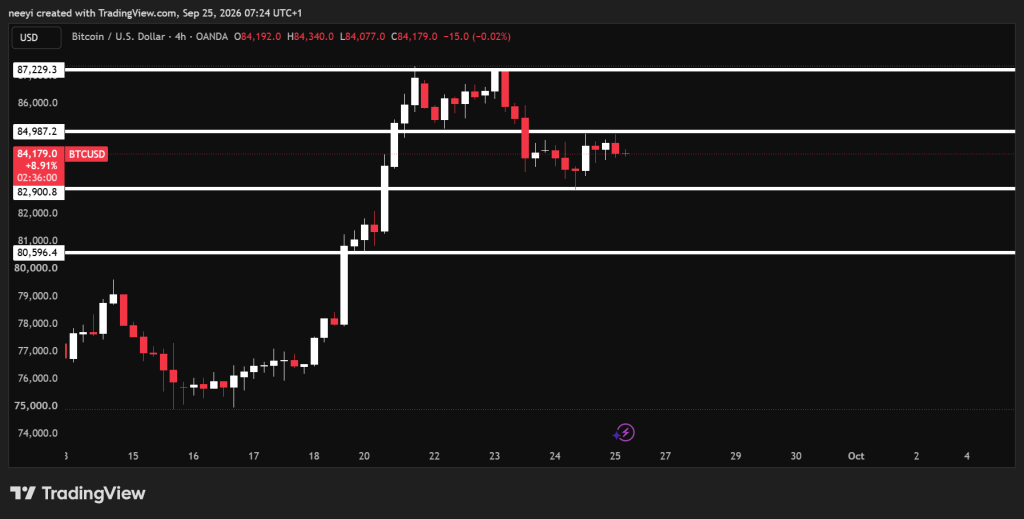
A move above $85,000 could open a path toward $86,000 or $87,000 today. Bitcoin could also spend more time inside its existing range if neither side takes control. A drop below $82,900 would put $80,000 in view before the end of the day.
The indicators give a mixed reading, which fits the recent consolidation.
| Indicator | Reading | What It Means for Bitcoin Price |
|---|---|---|
| RSI (14) | 54.168 | Momentum is slightly above the midpoint, but the reading does not show a strong move in either direction. |
| MACD (12, 26) | 780.7 | The positive reading favors the upside, although Bitcoin still needs to clear $85,000. |
| Ultimate Oscillator | 41.463 | The reading points to weaker buying pressure and calls for caution near resistance. |
| Bull/Bear Power (13) | -219.0489 | The negative value shows that sellers retain some influence despite BTC trading near the range high. |
The RSI leaves room for Bitcoin to rise, and the MACD provides a positive signal. The Ultimate Oscillator and Bull/Bear Power make the picture less convincing. That combination makes a clear break above $85,000 more useful than the indicator readings alone.
Bitcoin Price Prediction for Today
- Bullish: Bitcoin breaks above $85,000 and holds that level. BTC could then test $86,000, followed by $87,000 if the move continues.
- Neutral: Bitcoin remains between $82,900 and $85,000. Price could move back and forth across that range through the day.
- Bearish: Bitcoin falls below $82,900. That would expose $80,000 as the next downside level in this outlook.
Ethereum Price Needs a Break Beyond $2,630 or $2,700
Ethereum price has also been confined to a narrow range since Wednesday. ETH has traded between $2,630 and $2,700, with each boundary holding through recent attempts to move beyond it.
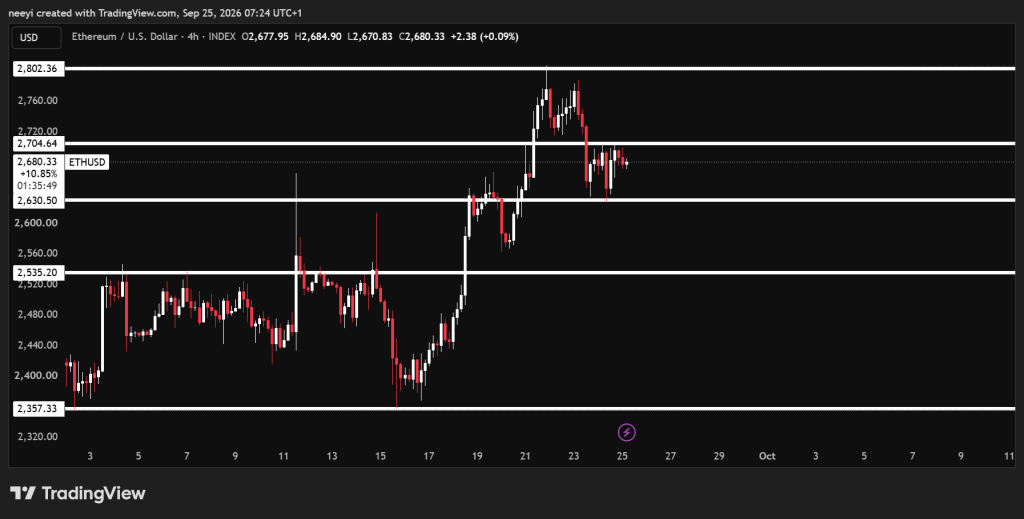
A break above $2,700 could take Ethereum toward $2,800 today. If ETH loses $2,630 instead, the next levels to watch are $2,570 and possibly $2,530. Until either boundary gives way, the range remains the clearest guide to its next move.
Ethereum’s indicator readings resemble Bitcoin’s: the MACD is positive, but other measures show that buyers have more work to do.
| Indicator | Reading | What It Means for Ethereum Price |
|---|---|---|
| RSI (14) | 52.138 | Momentum is close to balanced, with a small advantage for buyers. |
| MACD (12, 26) | 21.72 | The positive reading supports an upside attempt if ETH can get beyond $2,700. |
| Ultimate Oscillator | 47.698 | Buying pressure remains below the midpoint, so an upward move needs stronger follow through. |
| Bull/Bear Power (13) | -3 | The negative reading shows that sellers still have some control within the range. |
Ethereum’s RSI is only slightly above 50. Its MACD points upward, though the Ultimate Oscillator and Bull/Bear Power do not confirm a strong move. A look at the ETH price range makes the practical test simple: buyers need to clear $2,700, and sellers need to force a break below $2,630.
Ethereum Price Prediction for Today
- Bullish: Ethereum moves above $2,700 and holds there. ETH could then make a run toward $2,800.
- Neutral: Ethereum stays between $2,630 and $2,700. Neither side would have established a clear direction.
- Bearish: Ethereum breaks below $2,630. Price could fall toward $2,570, with $2,530 possible if selling continues.
Solana Price Has Stronger Indicators but Still Faces $119
Solana price has moved between $113 and $119 since Monday. SOL currently trades around $116, near the middle of that range. The pattern could continue today, or even through the week, if price cannot get beyond either boundary.
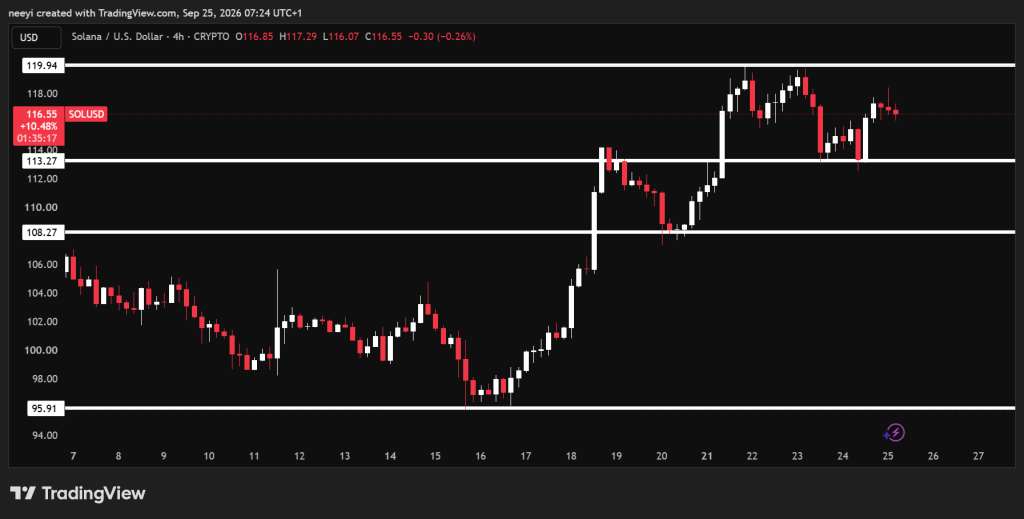
Solana stands apart from Bitcoin and Ethereum because all 4 supplied indicators favor buyers. That agreement gives an upside break more support, although SOL must still move above $119 to confirm it. A fall below $113 would change the picture and put $108 in focus.
| Indicator | Reading | What It Means for Solana Price |
|---|---|---|
| RSI (14) | 57.436 | Momentum favors buyers, with the reading above the midpoint. |
| MACD (12, 26) | 1.883 | The positive value supports a possible move toward the top of the range. |
| Ultimate Oscillator | 52.124 | Buying pressure has moved above the midpoint, adding support to the positive readings. |
| Bull/Bear Power (13) | 3.06 | The positive value shows buyers have an advantage within the current range. |
Those readings make Solana’s setup the strongest of the 3 on the supplied indicators.
Still, indicator strength does not guarantee a breakout. SOL has traded below $119 for days, so that level remains the test for any move toward $128.
Solana Price Prediction for Today
- Bullish: Solana breaks above $119 and maintains the move. SOL could then climb toward $128 today.
- Neutral: Solana continues trading between $113 and $119. Its positive indicators would remain encouraging, but price would still be range-bound.
- Bearish: Solana drops below $113. That would weaken the current setup and bring $108 into view.
FAQs
Subscribe to our YouTube channel for daily crypto updates, market insights, and expert analysis.