
The Bitcoin price is up 1.15% and trading at $85,987.80, but the bigger question is whether this recovery can hold or if Bitcoin could eventually fall back toward $60,000. The BTC price briefly crossed $87,300 on September 22, recovering about 15% from its recent low near $75,500.
That rebound came as ETF buying returned, short positions were liquidated and broader macro conditions improved. Yet, the path ahead is far from certain.
Bitcoin’s 200-week moving average and other major support levels have climbed above $65,000, giving the market a higher floor than in previous periods. Still, inflation, Treasury yields, ETF flows and leverage could determine whether $60K remains a distant downside target or becomes relevant again.
With all of these factors in play, we asked Claude AI if BTC could crash back to $60K after its stunning recovery, and what could happen to the Bitcoin price for the rest of 2026.
What you'll learn 👉
What We Asked Claude AI About Bitcoin’s Next Big Move
The Bitcoin price has just delivered a strong recovery, climbing from around $75,500 to above $87,300 in roughly a week before easing back to $85,987.80, leaving investors questioning whether the move can continue or if the Bitcoin price could eventually revisit $60,000.
The recovery was supported by several factors, including nearly $1 billion in U.S. spot Bitcoin ETF inflows on September 21, more than $420 million in Bitcoin short liquidations within 24 hours and improving macro conditions as crude oil moved below $100 per barrel and Treasury yields softened.
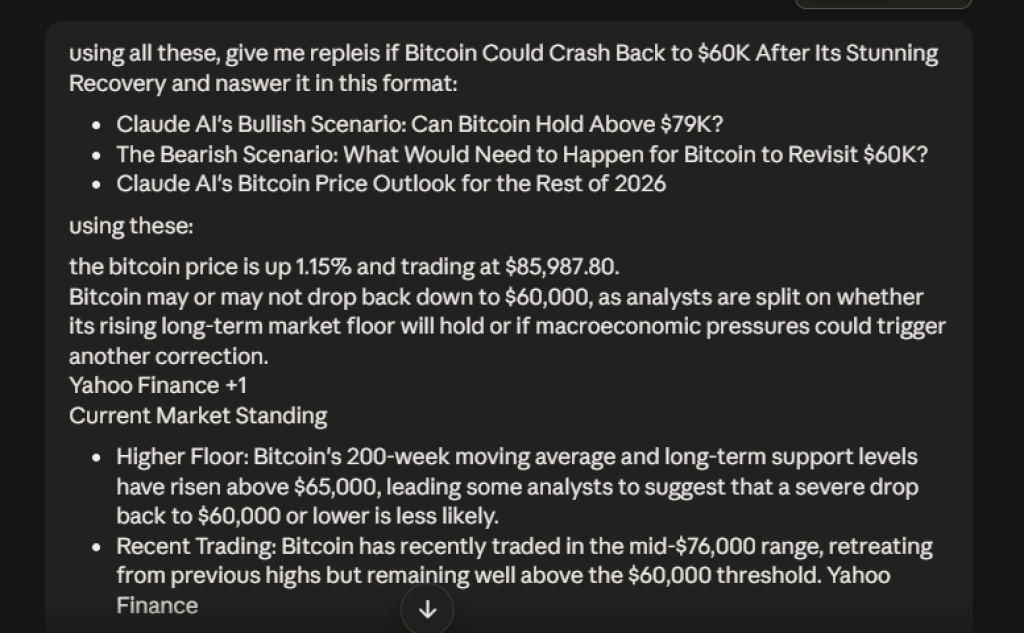
We gave Claude AI this market data along with the key arguments on both sides of the $60K question. On one side, Bitcoin’s 200-week moving average and other major support levels have risen above $65,000, creating a higher market floor, and the Bitcoin price has reclaimed its 50-week moving average while breaking its previous lower-high structure.
On the other side, renewed inflation pressure, higher Treasury yields, weaker ETF flows, excessive leverage or a breakdown in higher lows could expose BTC to deeper downside.
We then asked Claude AI to assess three specific possibilities: Can Bitcoin hold above $79,000 and continue toward the $93,000–$100,000 zone, what would need to happen for the Bitcoin price to fall back toward $60,000, and where could BTC trade for the rest of 2026?
The analysis also considers the role of ETF demand, short liquidations, open interest, funding rates and the technical levels that could confirm or weaken the recovery. With that context established, here is what Claude AI says about Bitcoin’s bullish case, bearish scenario and potential price path through the rest of 2026.
Claude AI’s Bullish Scenario: Can Bitcoin Hold Above $79K?
The bullish case starts with Bitcoin’s higher market floor. The 200-week moving average and other long-term support levels have moved above $65,000, meaning the Bitcoin price would have to break through several established support zones before reaching $60,000.
The latest recovery also pushed BTC through $82,000 and toward $87,300, leaving the $82,000–$83,000 area as an important zone for buyers to defend.
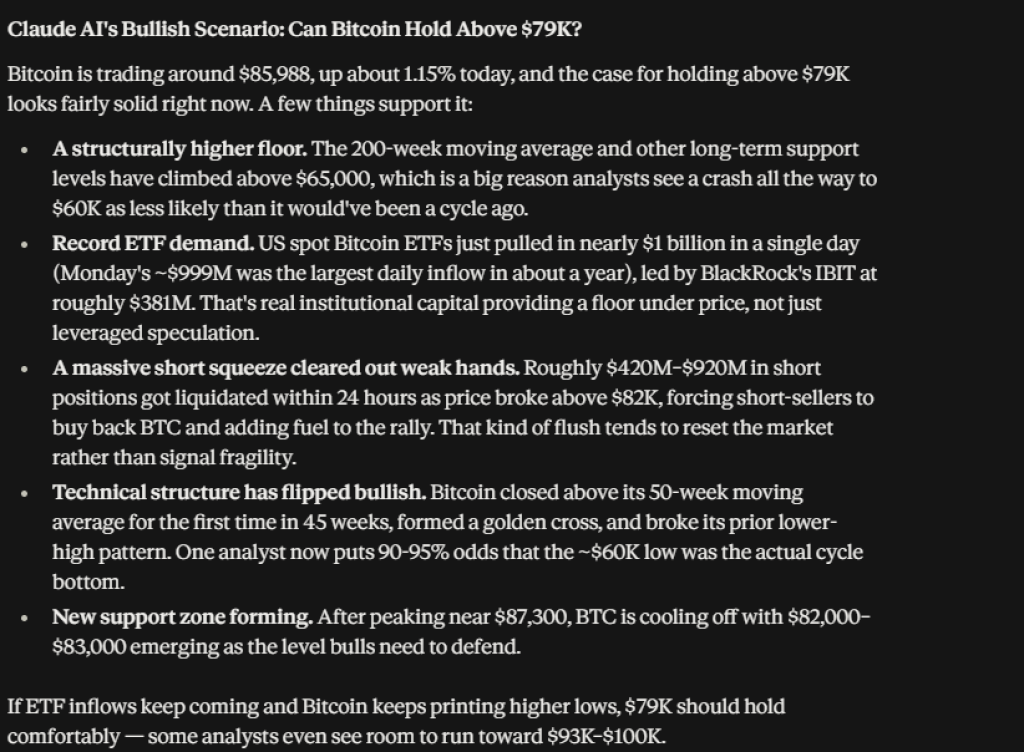
ETF demand adds another major factor. U.S. spot Bitcoin ETFs recorded $998.95 million in net inflows on September 21, their largest single-day inflow in about 12 months. BlackRock’s IBIT accounted for $381.4 million of that total. If these inflows continue, they could provide sustained spot demand beneath the Bitcoin price instead of leaving the recovery dependent only on derivatives.
The rally also received a large boost from short liquidations. More than $420 million in Bitcoin short positions were reportedly wiped out within 24 hours, with CoinGlass data showing $168.56 million in BTC shorts liquidated versus $37.03 million in longs. Bitcoin also reclaimed its 50-week moving average, broke its previous lower-high structure and formed a golden cross.
That leaves $79,000 well below the latest market price. If the Bitcoin price continues forming higher lows and holds the $82,000–$83,000 support zone, the bullish scenario points toward the $93,000–$100,000 region next. Analyst Kevin Capital has also put a 90%–95% probability on the roughly $60,000 low being the cycle bottom, though that is his assessment rather than a guaranteed outcome.
Related Bitcoin News: Here’s Why Gold Price Is Crashing While Bitcoin Rallies
The Bearish Scenario: What Would Need to Happen for Bitcoin to Revisit $60K?
For the Bitcoin price to fall toward $60,000, the current support structure would need to deteriorate considerably. One major trigger would be a sustained reversal in ETF flows. The latest $998.95 million inflow provides strong evidence of institutional buying, but a return to persistent outflows would remove part of the demand supporting the recovery.
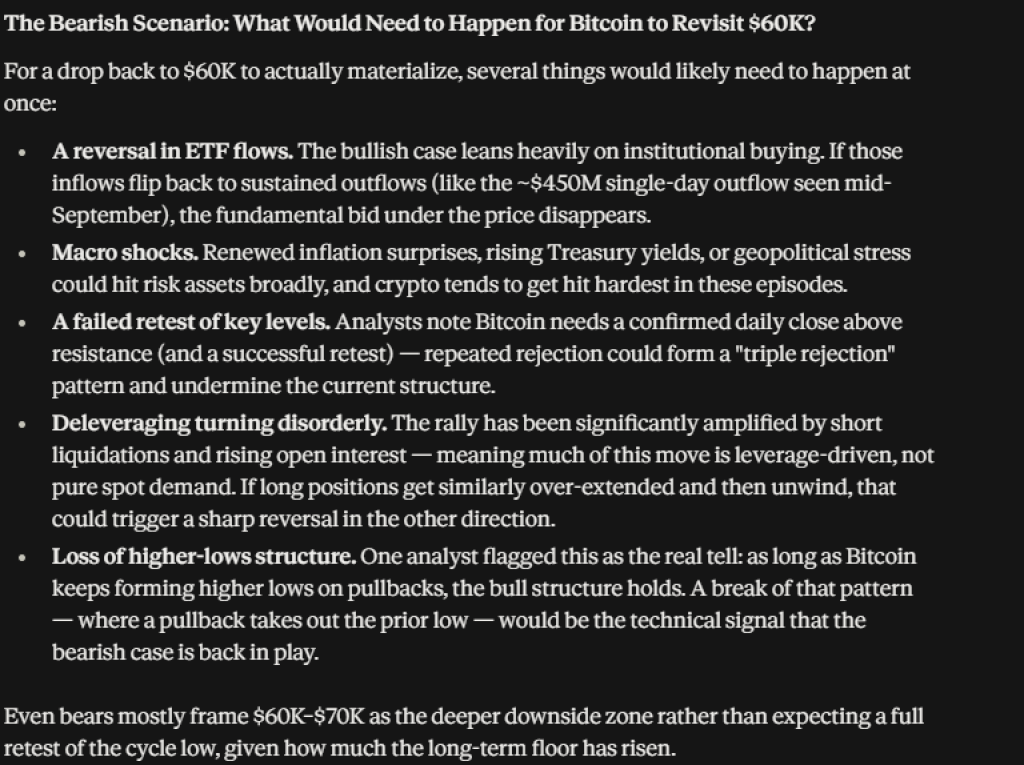
Macro conditions could create another source of pressure. Inflation concerns, higher Treasury yields or renewed geopolitical stress could weigh on risk assets, including Bitcoin. The recent recovery benefited from crude oil moving below $100 a barrel and softer long-term U.S. Treasury yields, so a reversal in those conditions could change the environment.
Leverage is another risk. The move toward $86,000 was driven heavily by short liquidations, and futures open interest and funding rates also increased. If traders become excessively leveraged on the long side, another liquidation wave could accelerate a decline. The key technical warning would be a loss of the higher-low structure. A break below important support levels could open the door toward the $70,000 area and, under a much more severe combination of macro and market pressure, potentially $60,000.
Claude AI’s Bitcoin Price Outlook for the Rest of 2026
Claude AI’s outlook leans toward a Bitcoin price range of $80,000–$90,000 in the near term, provided the $82,000–$83,000 support zone holds. Continued ETF inflows could give the BTC price room to retest the $87,300 area and potentially move toward the $93,000–$100,000 resistance zone identified by Kevin Capital.
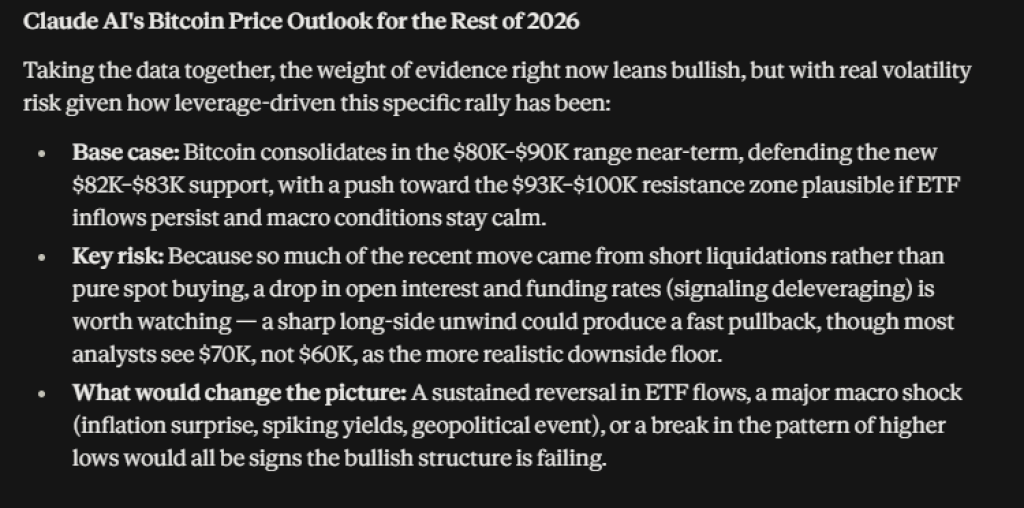
The main risk is that the latest recovery relied heavily on derivatives liquidations. CoinGlass recorded $168.56 million in BTC short liquidations against $37.03 million in longs, meaning leverage played a major role in the move.
A decline in open interest and funding rates could therefore become important signs that excess leverage is being removed.
A sustained ETF outflow trend, a major macro shock or a break in Bitcoin’s higher-low structure would weaken the bullish case. For now, the data places $82,000–$83,000 ahead of $60,000 as the key area to watch. A deeper move toward $60K would likely require several bearish factors to arrive together, not simply a normal correction after the recovery.
Frequently Asked Questions
Subscribe to our YouTube channel for daily crypto updates, market insights, and expert analysis.