XRP price is having an ugly Wednesday. Ripple’s token has fallen below $1.30 and is down roughly 8% today, extending the broader crypto selloff that began after the U.S. Senate failed to advance the CLARITY Act on Tuesday.
The timing could hardly be more difficult for XRP. The CLARITY Act failed to clear the 60-vote threshold needed to advance, receiving a 50-49 majority, and Bitcoin and crypto-related stocks fell following the vote. Now traders are preparing for today’s Federal Reserve decision, with markets pricing more than a 90% probability of a 25-basis-point rate hike.
Against this backdrop, CasiTrades, an analyst we regularly cover at CaptainAltcoin, says XRP has now invalidated a bullish structure she had been monitoring for a possible move toward $1.78.
More importantly, her old downside target near $0.87 (which appeared increasingly unlikely following XRP’s August rally) cannot be dismissed anymore.
What you'll learn 👉
XRP Breaks the Support CasiTrades Needed to Hold
CasiTrades’ latest analysis focuses on XRP breaking below the 0.5 Fibonacci retracement around $1.34.
That level can be seen clearly on her one-hour Coinbase chart. XRP had spent much of late August and early September moving around the $1.34-$1.43 region, repeatedly finding buyers near the lower end.
That changed with the latest selloff.
The chart shows XRP falling rapidly from around $1.40 toward $1.26, breaking the 0.5 retracement at approximately $1.3434 and moving into the next Fibonacci support area.
According to CasiTrades, that breakdown invalidates the Wave 4 structure she had been following. Under that interpretation, XRP was supposed to complete the correction and eventually produce one final wave toward approximately $1.78.
That particular setup is no longer valid.
It doesn’t necessarily mean XRP’s entire longer-term bullish structure has failed. Rather, the analyst believes the correction may need to go considerably deeper before XRP can establish another potential bottom.
CasiTrades Is Now Watching $1.10
The immediate area on her chart is around $1.26-$1.24.
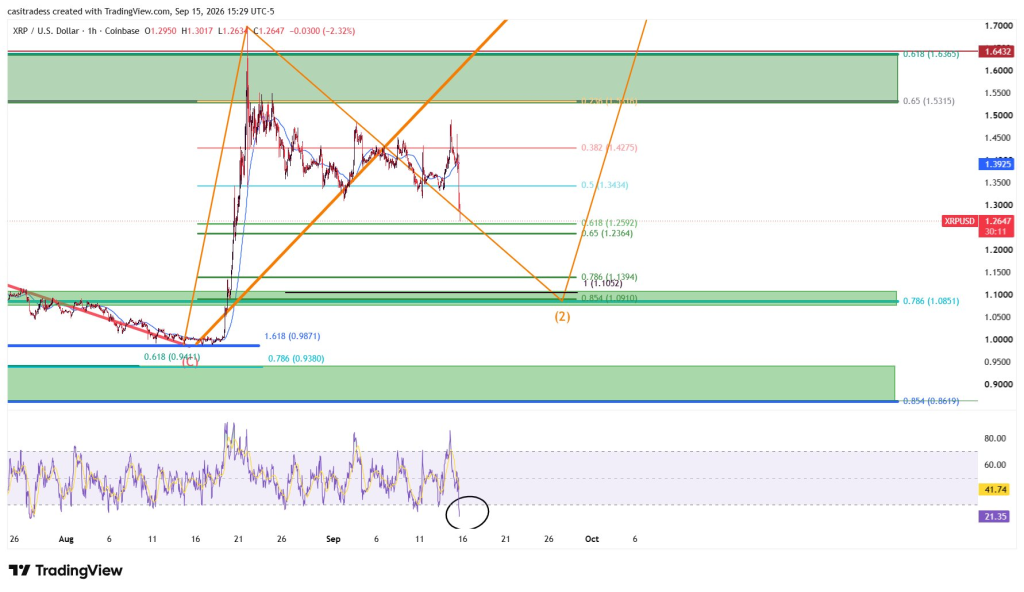
Specifically, the chart marks Fibonacci levels at approximately $1.2592 and $1.2364. With XRP already trading near $1.26 when the chart was captured, these levels are effectively being tested now.
But CasiTrades’ main downside level is considerably lower.
She is watching the macro 0.786 Fibonacci retracement around $1.10.
Her chart contains several nearby technical levels around this region: approximately $1.1394, $1.1052, $1.0910 and $1.0851. Together, they create a fairly broad support cluster around roughly $1.08-$1.14.
The orange path drawn on the chart illustrates her current Elliott Wave scenario. It takes XRP lower toward approximately $1.10 to complete what she labels Wave (2), followed by a potentially powerful recovery.
That recovery path is only a scenario, however. Elliott Wave counts are interpretive, and XRP reaching $1.10 wouldn’t guarantee the projected rebound.
Read also: XRP Investment Case: 21Shares Reveals the 4 Pillars Behind It
Is CasiTrades’ $0.87 XRP Target Really Back on the Table?
This is perhaps the most interesting part of her latest update.
CasiTrades had been talking about the possibility of XRP falling toward approximately $0.87 for months. The powerful August rally made that scenario look considerably less relevant as XRP exploded from below $1 toward $1.70.
But she never completely eliminated the deeper Fibonacci level from her macro chart.
Now it matters again.
The lower green support region on her chart extends roughly from $0.94 toward $0.86, with the macro 0.854 Fibonacci retracement marked at approximately $0.8619.
CasiTrades rounds that area to approximately $0.87 and notes that it remains untested across most markets.
So, is $0.87 back on the table?
Under her technical framework, yes, but it isn’t currently the primary level she’s watching. Her more immediate focus is $1.10. XRP would need to break through that major support cluster before the deeper $0.87 scenario became considerably more relevant.
From the chart price of roughly $1.26, a decline to $1.10 would represent another drop of around 13%. Reaching $0.87 would require a decline of roughly 31%.
XRP Bulls Still Have a Way to Invalidate the Bearish Scenario
There is also an important upside level in CasiTrades’ analysis.
She has repeatedly argued that XRP needs to break the macro 0.618 Fibonacci retracement around $1.65 and then hold it as support before the lower Fibonacci targets can be taken off the table.
Her chart shows a major green resistance region beginning around $1.53 and extending toward $1.64. The macro 0.618 level itself is marked around $1.6365.
Before XRP can even think about that area, however, bulls have several nearer obstacles.
The first is reclaiming approximately $1.34, followed by the $1.43 region. Above there, $1.53-$1.64 becomes the major resistance zone.
That is a substantial distance from where XRP trades now.
Fed Decision Adds Another Risk for XRP Price Today
XRP price crash is occurring during an unusually important macro week.
Tuesday’s CLARITY Act vote was a disappointment for the crypto industry. The Senate failed to advance the legislation after the procedural vote fell short of the required 60 votes. The bill is stalled for now, although the procedural maneuvering leaves open the possibility that it could be reconsidered.
Attention has now moved to the Federal Reserve.
The Fed announces its decision at 2 p.m. ET today, September 16. Markets are pricing roughly a 90% chance of a quarter-point increase, while Treasury yields and the U.S. dollar have risen as investors prepare for potentially tighter monetary policy.
That environment has been difficult for crypto, and XRP is reacting particularly poorly.
The important distinction is that we cannot know from the price chart alone how much of XRP’s 8% decline is specifically attributable to the CLARITY Act, Fed expectations or broader crypto selling. But all three are occurring as XRP breaks levels that mattered to CasiTrades’ technical thesis.
For now, $1.24-$1.26 is the immediate battleground. If that area cannot hold, the analyst’s much more important $1.08-$1.14 support region comes into focus.
And if $1.10 eventually fails decisively, the $0.87 target CasiTrades has discussed for months would become realistic.
For more crypto news and price predictions, click here.
Subscribe to our YouTube channel for daily crypto updates, market insights, and expert analysis.