
Gold and silver prices are falling again, and their latest attempts to recover have done little to stop the decline. Gold has already lost a support area that held since early August. Silver is testing a similar boundary, which makes the next price moves important for both metals.
The weakness goes beyond a disappointing trading session. Economic pressures help explain the selling, but the charts also reveal why a small bounce may struggle to become a lasting recovery.
Gold price dropped to around $4,250 yesterday after breaking below its August support area. A modest rebound followed, but today’s trading remains below that former floor.
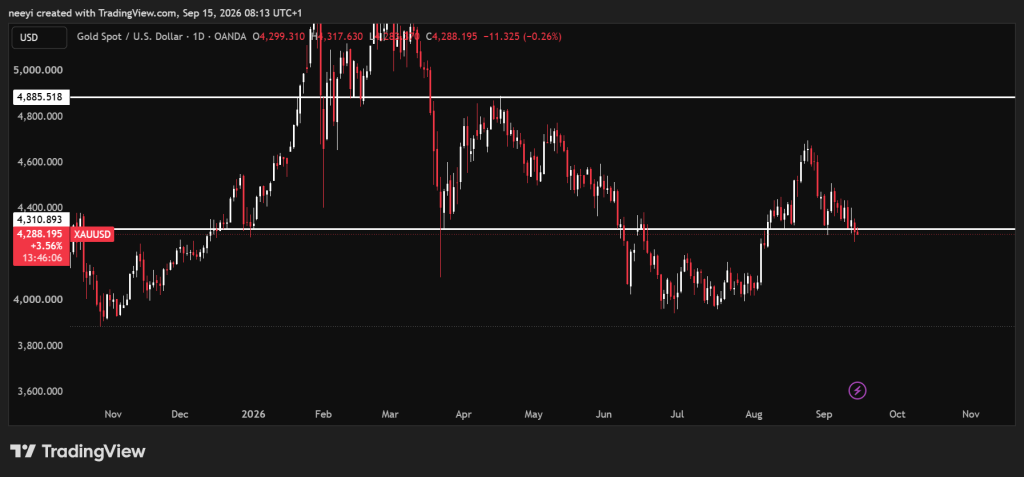
That matters because broken support can become resistance. Buyers who previously defended the area now need to reclaim it before the chart offers stronger evidence of stabilization.
Continued rejection below that boundary could leave $4,220 as the next downside level described in the price outlook. A recovery back above the former support would weaken that bearish scenario, although holding the level would matter more than briefly crossing it.
Silver price also slipped slightly below its August support yesterday. Further weakness today could confirm that sellers are pushing the metal outside its previous consolidation range.
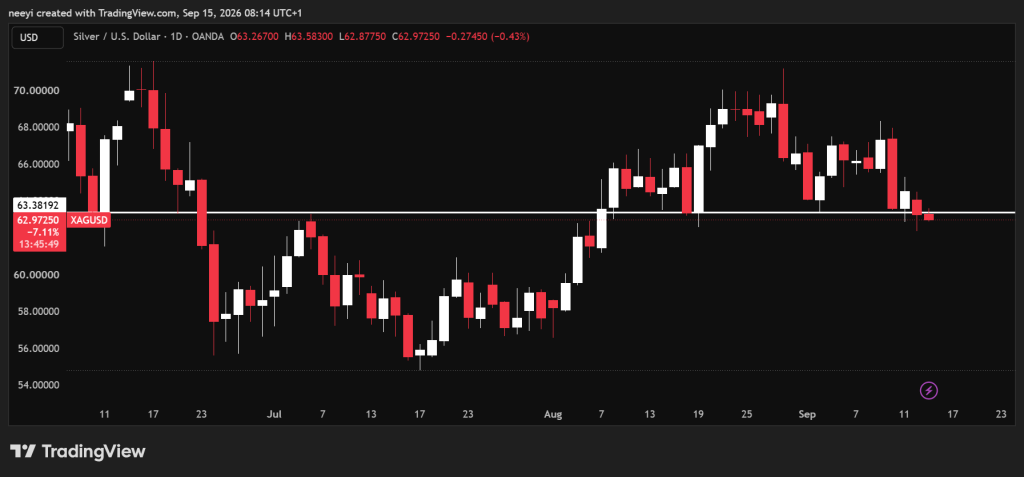
The alternative is a return above the broken support. That would put silver back inside the range and reduce the immediate pressure for another decline.
Neither outcome is confirmed simply because price crosses the boundary once. Sustained trading below it would strengthen the bearish case, and a lasting recovery above it would offer better evidence of stabilization.
What you'll learn 👉
Interest Rate Expectations And Dollar Strength Pressure Both Metals
The macroeconomic explanation supplied for this decline centers on expectations of a possible Federal Reserve rate increase. That remains an expectation rather than a confirmed decision.
Higher bond yields can make gold and silver less attractive because neither metal pays interest. The more important measure is real yields, which account for inflation. Higher nominal rates do not automatically mean higher real returns.
A stronger US dollar also makes metals more expensive for buyers using other currencies. Rising oil prices can reinforce inflation concerns and expectations of tighter monetary policy, although inflation itself can also support demand for gold.
Profit taking after the earlier rally offers another possible explanation. These forces can reinforce each other, but the price chart alone cannot establish how much selling each caused.
Physical Demand And Cash Needs Explain Deeper Price Pressure
Gold and silver can also decline for reasons beyond daily policy expectations:
- Strong equity returns can draw money toward stocks and reduce demand for defensive assets.
- Severe market losses can force investors to sell liquid metals to meet margin calls.
- Easing geopolitical tensions can reduce the extra premium associated with demand for protection.
Silver has greater exposure to manufacturing through solar panels, electronics, and automotive production. Slower industrial activity can therefore pressure silver more directly than gold.
Improved mining methods can increase supply over time, although production responses are rarely immediate. Expensive jewelry and weaker household spending in India and China can also reduce physical purchases. These are broader mechanisms, not confirmed explanations for every part of today’s decline.
Read Also: When Should You Sell XRP? Analyst Maps His Exit Strategy
Gold Indicators Favor Sellers Despite A Positive MACD
Gold’s RSI of 43.897 carries a Sell reading and points to weaker momentum below 50, without reaching the conventional oversold threshold of 30.
The Ultimate Oscillator at 35.046 also favors sellers. Bull/Bear Power of negative 135.5021 reinforces that weakness. MACD at 8.06 carries a Buy reading, but that positive result alone does not confirm a price reversal.
| Gold Moving Average | Simple Value | Action | Exponential Value | Action |
|---|---|---|---|---|
| MA20 | $4,444.68 | Sell | $4,367.30 | Sell |
| MA50 | $4,280.22 | Buy | $4,350.91 | Sell |
| MA200 | $4,544.42 | Sell | $4,316.79 | Sell |
Most supplied moving average readings favor selling. The MA50 simple Buy label needs caution because gold below $4,280.22 would ordinarily produce a Sell comparison. Different snapshot times could explain that mismatch.
Silver Indicators Also Favor Sellers As Recovery Remains Unconfirmed
Silver’s RSI of 44.214 and Ultimate Oscillator of 35.753 both carry Sell readings. Bull/Bear Power of negative 3.3485 also favors sellers, although MACD at 0.294 carries a Buy reading.
| Silver Moving Average | Simple Value | Action |
|---|---|---|
| MA20 | $66.2642 | Sell |
| MA50 | $62.7511 | Buy |
| MA200 | $73.2745 | Sell |
Silver’s supplied MA50 reading is more supportive than its MA20 and MA200 readings. No exponential values or indicator timeframe were provided, which limits further comparison.
FAQs
Subscribe to our YouTube channel for daily crypto updates, market insights, and expert analysis.