
The Bitcoin price enters September 9 with bulls facing a familiar obstacle: $80,000. BTC is down 0.52% over 24 hours at $78,698.99 after failing to sustain a breakout above that barrier, with renewed macro uncertainty adding pressure.
The move also comes as Bitcoin’s seven-day correlation with gold reaches 73%, pointing to similar inflation-hedge positioning across both assets. Short-term holders’ unrealized profits have peaked and declined, adding another warning for buyers after BTC slipped from the high-$79,000 to $80,000 area.
Still, the longer-term demand picture has support from Tether, which has directed up to 15% of operating profits into Bitcoin since May 2023. With the BTC price near $79,000 support, the key question is where the Bitcoin price goes next before another breakout attempt.
What you'll learn 👉
News That Could Move Bitcoin Price Today
Bitcoin’s network activity has delivered a notable data point ahead of September 9. Galaxy Research recorded 893,391 confirmed BTC transactions on September 6, putting that day above the 99th percentile of all historical Bitcoin on-chain activity. It was the fourth-highest daily transaction count in Bitcoin’s history, showing that network usage has been unusually heavy even as the Bitcoin price struggles beneath $80,000.
The transaction count needs some context, however. Most of those transfers were small, low-fee transactions, meaning the record number does not necessarily indicate that an enormous amount of capital moved on-chain. For the Bitcoin price, the more useful metric from here may be whether transaction values and fee activity increase alongside the elevated transaction count.
That network activity comes at a time when ETF demand remains strong, creating an interesting contrast. The Bitcoin price is trading below major resistance despite heavy on-chain usage and institutional demand. The next data point to watch is therefore the composition of transactions and fee trends. If higher-value transfers and fees begin rising with activity, it would provide stronger evidence of economic demand for the network.
Macro data also has the potential to determine today’s direction. The calendar includes ADP Weekly Employment Change at 11.8K, a 10-year Treasury bond auction at 4.68 with a 2.5 bid-to-cover figure, and the API Weekly Statistical Bulletin later in the day. Employment figures and Treasury demand can influence yields and liquidity expectations, giving traders another reason to watch the Bitcoin price around the $79,000 area.
What Is the Bitcoin Chart Showing Today?
We had a look at the chart, and the structure remains cautious after the failed move above $80,000. The Bitcoin price pushed above $81,500 and briefly reached the $82,000–$82,400 region before sellers took control.
The subsequent decline produced lower highs, with price moving through $80,400, $79,600 and then toward the current $78,725 area shown on the chart. This creates a clear resistance ladder that buyers must reclaim before another test of the September high.
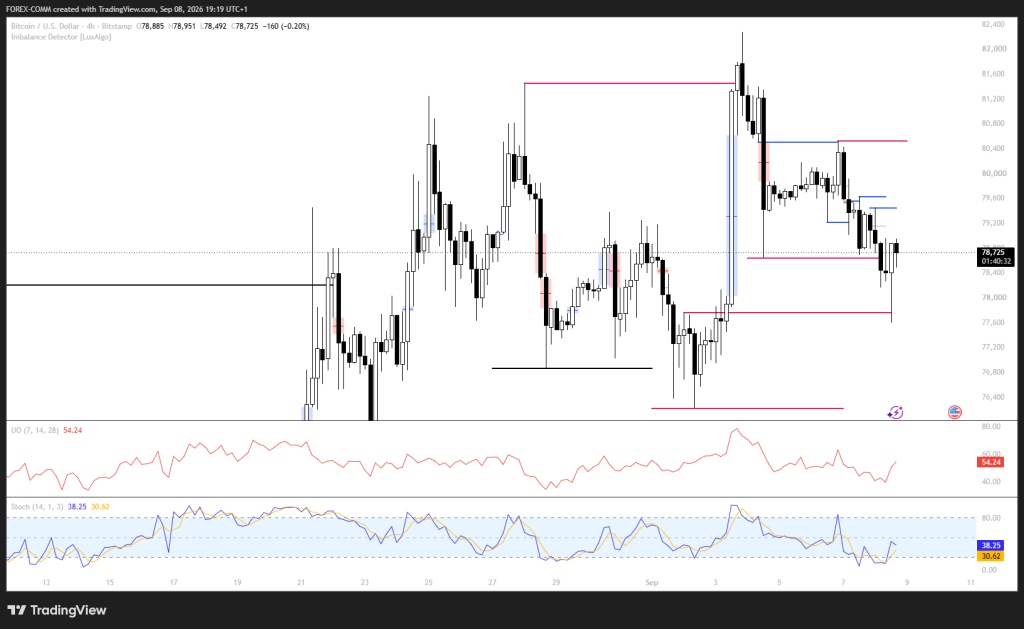
The first area to watch is $79,200–$79,600. The chart shows several blue resistance levels in this region, making it the immediate barrier for a recovery. Above that zone, $80,400 becomes the next major objective, followed by the red resistance around $81,500. A break above $81,500 would reopen the path toward the recent high near $82,400.
Momentum indicators are showing some room for recovery but have not confirmed a bullish breakout. The Ultimate Oscillator reads 54.24, above its midpoint of 50, giving buyers a modest advantage.
The Stochastic indicator has %K at 38.25 and %D at 30.62, meaning short-term momentum is recovering from lower levels. That recovery could support a move back toward $79,600, but Bitcoin still needs price confirmation above the resistance zones.
Support is concentrated around $78,400, followed by the $77,600–$77,800 region marked on the chart. A deeper decline would expose the $76,800 area, which has acted as an important reaction zone during the displayed period. As long as Bitcoin holds above these levels, buyers have room to attempt another recovery. Losing $76,800 would weaken the near-term structure considerably.
Related Bitcoin News: Bitcoin Price Has 85 Days Before This Historic Buying Window Closes
Where Will BTC Price Go Today?
Bullish Path: $80,400–$81,500
The bullish Bitcoin price scenario starts with a recovery above $79,600. If buyers clear that resistance, BTC could target $80,400, followed by $81,500. A break above $81,500 would put the recent $82,400 high within reach. The UO reading of 54.24 and recovering Stochastic readings give this scenario some technical support.
Bearish Path: $77,600–$76,800
A failure to reclaim $79,200–$79,600 could keep sellers in control. If BTC breaks below $78,400, the next target is around $77,600, with $76,800 as the deeper support. Losing $76,800 would create room toward the lower $76,000–$77,000 support zone identified in the broader market setup.
Likely Path: $78,400–$80,000
The most balanced scenario for September 9 is consolidation between $78,400 and $80,000 as Bitcoin attempts to recover from the failed breakout. The key trigger remains $79,600: reclaiming it would improve the case for $80,400, whereas a break below $78,400 would increase the probability of $77,600 and $76,800.
However, tether’s estimated 83,000–100,000 BTC treasury, worth more than $8 billion, provides a notable institutional demand backdrop, but today’s Bitcoin price is still likely to respond first to resistance, liquidity and macro data.
Frequently Asked Questions
Subscribe to our YouTube channel for daily crypto updates, market insights, and expert analysis.