
Gold price is starting the new week under some selling pressure, with the gold price falling about 1% and slipping below $4,400 per ounce on Monday. Spot gold traded near $4,395 during the Asian session as stronger U.S. employment data kept expectations for another Federal Reserve rate increase alive.
The pullback comes despite another major development on the demand side. China’s central bank added 650,000 ounces of gold to its reserves in August, its largest monthly increase in almost three years. Official reserves reached 76.73 million ounces, extending China’s buying run to 22 consecutive months.
That creates an interesting conflict for gold investors. Short-term macro conditions are weighing on the metal, but one of the world’s largest central banks continues accumulating bullion at an increasing pace.
What you'll learn 👉
China Just Made Its Biggest Gold Purchase Since 2023
The People’s Bank of China added 650,000 ounces, or roughly 20 tonnes, to its gold reserves during August.
That was up slightly from 640,000 ounces in July and 480,000 ounces in June. More importantly, it was the largest monthly increase since October 2023, when China added 740,000 ounces.
The chart of China’s central-bank purchases makes the acceleration easy to see.
Chinese buying was particularly aggressive during 2023, with several months exceeding 20 tonnes. Purchases then declined dramatically during 2024 and remained relatively small through much of 2025 and early 2026.
That changed over the past few months.
The bars on the right side of the chart rise from relatively modest purchases early this year toward roughly 5 tonnes, then around 8 tonnes, 10 tonnes, 15 tonnes and finally approximately 20 tonnes during July and August.
At the same time, the orange line representing gold has moved from below $2,000 in early 2023 to above $4,000.
🇨🇳 NEW: China added 650,000 ounces of gold to its reserves in August, its largest purchase since 2023, per Bloomberg. pic.twitter.com/elJWudxwmT
— Cointelegraph (@Cointelegraph) September 7, 2026
In other words, China hasn’t stopped buying simply because gold became considerably more expensive.
The World Gold Council reported that China had already accumulated around 60 tonnes during the first seven months of 2026, second only to Poland among reported central-bank buyers. China’s official gold holdings stood around 2,366 tonnes at the end of July and represented roughly 8% of its reserves.
August now extends that run further.
That doesn’t mean Chinese purchases alone determine the gold price. The chart shows periods when purchases slowed substantially while gold continued rising, demonstrating that the relationship isn’t mechanical.
Still, accelerating purchases above $4,000 provide an important piece of evidence that China’s long-term appetite for bullion remains intact.
Why Is Gold Price Falling Today?
Despite the bullish central-bank story, the gold price is down around 1% today and has fallen below $4,400.
The immediate pressure is coming largely from the macro side.
Stronger U.S. employment numbers have increased expectations that the Federal Reserve could keep monetary policy restrictive or potentially raise rates again. Higher interest-rate expectations generally create a headwind for gold because the metal doesn’t generate interest income.
Markets are now waiting for upcoming U.S. inflation numbers for more information about the Fed’s next decision.
There’s another factor worth remembering today: Labor Day.
U.S. stock markets are closed Monday, September 7, with both the NYSE and Nasdaq returning to regular trading on Tuesday.
Holiday trading can mean thinner liquidity across related markets. That can make intraday movements less reliable because fewer participants are active.
Gold & Silver — Labor Day
— Fthegurus (@fthegurus) September 7, 2026
U.S. equity markets are closed today for Labor Day, so expect a quieter day in precious metals.
Liquidity thins out, which often means fake breakouts, fake breakdowns, and moves that don’t follow through.
If you’re off, enjoy it. If you’re working,… pic.twitter.com/axPuUM22ea
For gold and silver traders, today’s move therefore deserves some caution.
A break below $4,400 during holiday-thinned trading isn’t necessarily confirmation that another major decline has begun. Likewise, a sudden recovery above $4,400 wouldn’t automatically establish that bulls have regained control.
The more informative test could arrive once U.S. markets return to normal conditions and traders begin positioning for this week’s inflation data.
Read more gold news: Central Banks Refuse to Stop Buying Gold
Analyst Says $4,300 Is the Gold Level to Watch
Analyst Rashad Hajiyev takes a bullish view of the current weakness.
His interpretation is that gold is consolidating before another leg higher, with approximately $4,300 providing important support.
The second chart fits that argument reasonably well.
Gold previously broke out from a large consolidation structure around $4,000–$4,200 and subsequently rallied toward approximately $4,700.
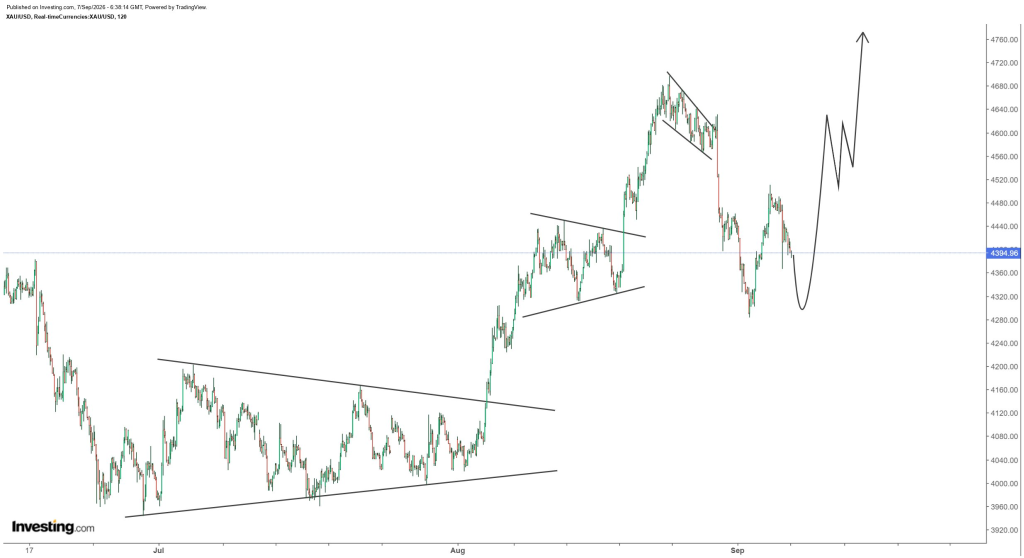
Price then formed another smaller descending structure near the highs before breaking lower.
The latest action has been volatile. Gold fell toward approximately $4,300, rebounded toward $4,500 and has now returned to roughly $4,395.
Hajiyev’s projected path allows for another test of the $4,300 area before a recovery.
That level is important for another reason. The 200-day moving average has recently been around $4,350, putting a major long-term technical reference relatively close to Hajiyev’s support zone.
If buyers defend approximately $4,300–$4,350, the current decline could remain part of a larger consolidation rather than the beginning of a deeper bearish move.
His bullish projection then anticipates a recovery through roughly $4,500, followed by another attempt at the $4,650–$4,700 region.
The chart eventually points toward approximately $4,750–$4,800.
That outcome is far from confirmed, however.
If $4,300 fails convincingly, the structure would look considerably weaker and the market could begin looking back toward lower support around $4,200 and potentially the $4,000–$4,100 region.
Gold Price Prediction: Can Gold Still Reach $5,000?
Our near-term outlook comes down largely to $4,300 versus $4,700.
At approximately $4,395, gold is caught between an important support area and the recent highs.
The first bullish requirement is simply defending $4,300–$4,350. If that happens, a recovery above $4,450 could bring $4,500 back into play.
Beyond there, $4,650–$4,700 becomes the much more important test.
A convincing break above $4,700 would indicate that the correction from the recent highs has likely run its course. The next area would be around $4,750–$4,800, and clearing that region would make the psychological $5,000 level increasingly realistic.
The bearish roadmap is equally straightforward.
Losing $4,300 would weaken Hajiyev’s consolidation thesis. A deeper decline toward $4,200 could follow, while $4,000–$4,100 would become increasingly relevant if selling accelerates.
For now, we would put the scenarios roughly like this:
Base case: Gold holds $4,300–$4,350 and spends some time consolidating before another attempt at $4,600–$4,700.
Bull case: Gold breaks $4,700, clears $4,800 and eventually challenges $5,000.
Bear case: $4,300 fails, opening a deeper correction toward approximately $4,100–$4,200.
China’s latest purchase strengthens the longer-term bullish argument but doesn’t eliminate the near-term risks.
For more crypto news and price predictions, click here.
Subscribe to our YouTube channel for daily crypto updates, market insights, and expert analysis.