
Last week’s ADA price prediction gave bulls a clear roadmap: hold $0.20, break $0.2115, and the Cardano price could move toward $0.23–$0.24, with $0.258 opening the door to $0.27–$0.28.
The bearish trigger was a loss of $0.20, which could expose $0.19 and the $0.173–$0.1709 zone. Cardano delivered the bullish outcome instead. The token is now at $0.21873, up 2.60% in 24 hours, and has moved above the $0.2115 level.
The move comes as Cardano DEX volume tripled to $7.28 million, with TVL also increasing. The next question is whether the Cardano price can turn $0.22 into a launchpad for $0.23, $0.24 and potentially $0.258 this week.
What you'll learn 👉
Catalysts That Could Push Cardano Price This Week
September 6 is an important date for Cardano governance, with a deadline for the Constitutional Committee vote. Also, DEX volume has climbed to $7.28 million, triple its earlier level, and TVL increased by 31.34 million ADA in less than two weeks.
The network is also preparing for the planned October 1 RealFi mainnet launch, which aims to bring real-world assets onto Cardano.
Scaling is another catalyst. Cardano is advancing its Hydra layer-2 solution, designed to increase transaction capacity and speed. Cardano infrastructure has also reportedly anchored about 500,000 supply-chain records, using hashes and timestamps to verify enterprise events. If this expands toward millions of records and deeper ERP integrations, it could create more demand for Cardano-based infrastructure.
Macro data could determine how much upside the Cardano price gets this week. U.S. inflation data will influence expectations for the Federal Reserve’s September meeting and could affect risk assets across crypto.
A softer inflation reading could support altcoins, giving ADA room to test its higher resistance levels. With ADA already outperforming a flat Bitcoin, stronger altcoin demand would strengthen the bullish case.
What Is the Cardano Chart Saying?
We had a look at the chart, and the first major development is the recovery from the $0.19–$0.20 area. The ADA price broke above the marked $0.20 resistance in late August and pushed toward $0.23, before consolidating. The latest move has reclaimed the $0.2188 region, placing ADA back inside the upper part of its recent range.
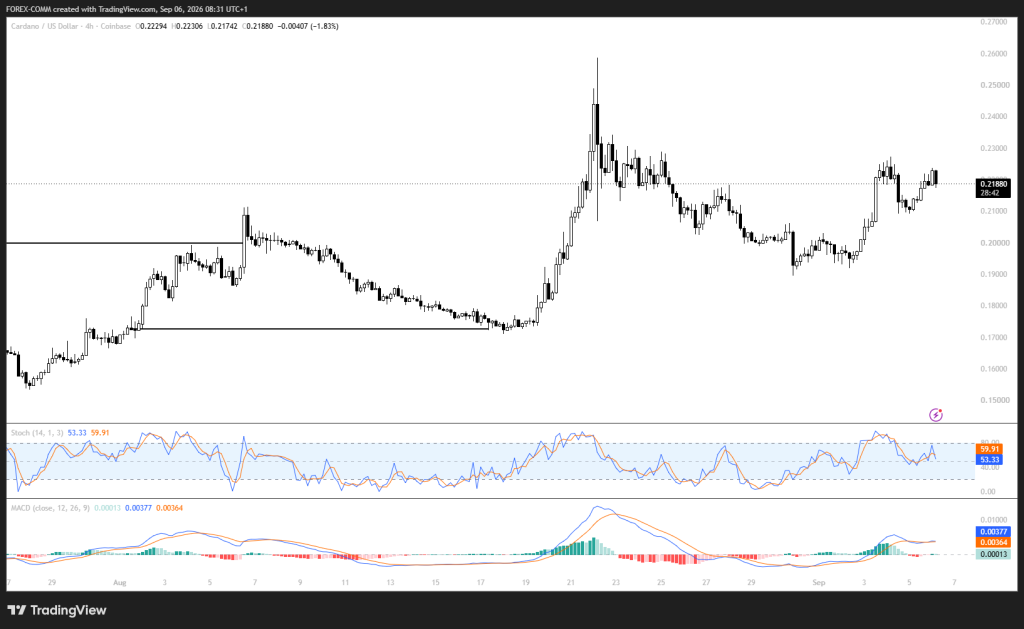
The immediate resistance is around $0.23. A clean break above that level would expose the August high near $0.24, followed by the larger resistance around $0.258.
The chart shows that the Cardano price previously moved rapidly from roughly $0.20 toward $0.25, so $0.23–$0.24 is the first area bulls need to clear before a larger move can develop.
Momentum is still constructive. The Stochastic oscillator is at 53.33, with its signal at 59.91, putting the indicator above the midpoint but below the overbought zone.
MACD remains positive, with the MACD line at 0.00377, signal at 0.00364, and histogram at 0.00013. This keeps the momentum setup mildly bullish, though a stronger expansion in momentum would help ADA clear $0.23.
The major downside reference is $0.20. As long as that level remains protected, the recovery structure remains intact. A break below $0.20 would bring $0.19 into play, followed by the $0.173–$0.1709 region. Losing $0.1709 would reopen the path toward $0.16.
Related Cardano News: Cardano Price News: ADA Is Up 69%, But Now Comes the Real Test
Where Will Cardano Price Go This Week?
Bullish path:
ADA holds above $0.2115, breaks $0.23, and targets $0.24. A move through $0.24 could put $0.258 within reach, with $0.27 possible if altcoin demand strengthens.
Neutral path:
The ADA price remains between $0.20 and $0.23, with buyers defending $0.2115 but struggling to clear $0.23. The token could retest $0.23 several times before attempting $0.258.
Bearish path:
ADA loses $0.20, opening $0.19 first. A break below that level could send the Cardano price toward $0.173–$0.1709, with $0.16 becoming the deeper target if $0.1709 fails.
Frequently Asked Questions
Subscribe to our YouTube channel for daily crypto updates, market insights, and expert analysis.