Gold is trying to bounce back after falling to its lowest level in nearly a month. Spot gold climbed 1.1% to $4,376.41 as the dollar and Treasury yields pulled back from their highs of the day.
The rebound came after the gold price touched its weakest point since August 7, giving buyers a chance to step in and defend the $4,300 area. Gold futures for December delivery also edged up 0.4% to settle at $4,414.60.
The next big test comes from U.S. jobs data. Unemployment claims are expected at 205,000, up slightly from 203,000, ahead of Friday’s nonfarm payrolls report. For today, the main question is whether $4,300 support can hold and push gold back toward $4,450 and then $4,600.
What you'll learn 👉
News That Could Influence Gold Price
U.S. jobs data will move gold more than anything else today. Unemployment claims come out at 1:30 p.m., expected at 205,000, up from 203,000 last time. If the numbers come in strong, that could boost the dollar and Treasury yields, which puts pressure on gold. But if the data is weak, people will bet on the Fed cutting rates, and that gives gold room to climb.
The ISM Services PMI drops at 3:00 p.m., another big one. A strong reading there could back the case for higher rates, especially after some Fed officials have sounded pretty hawkish lately.
On top of that, two Fed members, Hammack and Goolsbee, are speaking today, which could give traders more clues on what to expect in September. Higher rates make gold less attractive since it doesn’t pay interest, so that keeps the $4,300 area in focus.
Oil and Middle East tensions are still part of the picture too. The U.S.-Iran conflict pushed crude prices up above $90, which stokes inflation worries. If oil stays high, markets might price in more persistent inflation and a stronger Fed, which wouldn’t help gold. But on the other side, softer Treasury yields and a weaker dollar have already helped gold bounce off $4,300.
What Is the Gold Chart Saying?
We had a look at the chart, and the $4,300 level stands out immediately. Gold climbed from roughly $4,030 in late July to above $4,400 by mid-August before breaking higher toward $4,600.
The advance eventually reached around $4,670, where sellers took control. The decline then carried the gold price back toward $4,300, creating the most important short-term support zone on the chart.
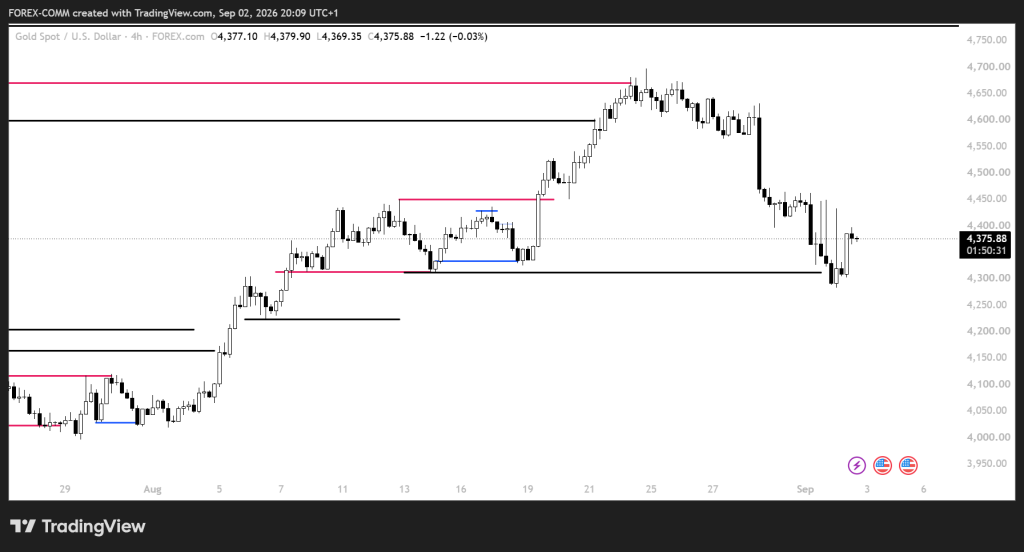
The latest candles show buyers defending that area. Gold dropped toward roughly $4,290-$4,300 before recovering to $4,375.88. That rebound places the first resistance around $4,400-$4,450. A break above $4,450 would open the way toward $4,600, which previously acted as a major resistance area.
The structure becomes weaker if the gold price loses $4,300 decisively. That would expose $4,220, followed by the $4,150 region. The chart also shows how quickly gold can travel between these levels, so the reaction around $4,300 should determine the next directional move.
Related Gold News: ChatGPT Predicts Silver and Gold Prices by the End of 2026
Where Will Gold Price Go Today?
Bullish path:
If unemployment claims come in above the 205K forecast, the ISM Services PMI disappoints, and Treasury yields continue falling, gold could break above $4,400. A move through $4,450 would put $4,600 in view, giving the gold price roughly 5.1% upside from $4,375.88.
Bearish path:
Strong U.S. data combined with hawkish Fed comments could lift the dollar and yields. A break below $4,300 would expose $4,220, with $4,150 becoming the next downside target. From $4,375.88, that would represent potential declines of about 3.6% and 5.2%, respectively.
Base-case path:
The most balanced scenario is consolidation between $4,300 and $4,450 as traders wait for Friday’s payrolls report. If $4,300 holds, the gold price could retest $4,400-$4,450 before the next major directional move.
Frequently Asked Questions
Subscribe to our YouTube channel for daily crypto updates, market insights, and expert analysis.