
Bitcoin is entering September on much stronger footing after delivering an impressive performance throughout August. BTC gained roughly 25% during the month, which gives bulls another reason to argue that the worst of the latest bear market is already behind it.
On the opening day of September, Bitcoin is trading around $79,000, keeping much of that recovery intact.
But CryptoCon, an analyst who has repeatedly argued on X that Bitcoin’s cycle bottom may still be ahead, isn’t ready to declare a new bull market just yet.
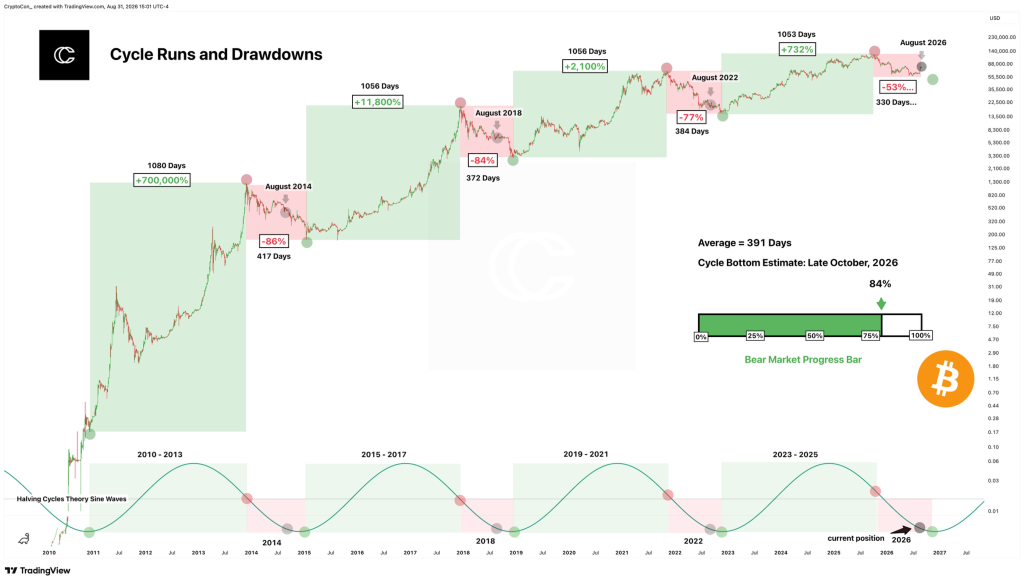
His latest chart compares the current Bitcoin decline with previous cycle drawdowns and indicates that, based purely on historical duration, the present bear market is approximately 84% complete.
That sounds bullish at first. The problem is that CryptoCon believes the remaining 16% could still include one final move lower.
What you'll learn 👉
Bitcoin Bear Market Is Already 84% Complete
CryptoCon’s argument revolves primarily around time rather than a specific Bitcoin price target.
His chart divides Bitcoin’s history into major bullish cycle runs followed by bear-market drawdowns. The previous three completed bear markets lasted approximately:
- 417 days following the 2013 cycle
- 372 days following the 2017 cycle
- 384 days following the 2021 cycle
That produces an average of roughly 391 days.
According to the chart, Bitcoin’s current bear-market phase has reached approximately 330 days, putting it about 84% of the way through the average historical duration.
If the current cycle were to follow that average closely, CryptoCon’s model places the potential cycle bottom around late October 2026.
That’s only around two months away, but it is also the reason he isn’t convinced the recent Bitcoin recovery necessarily marked the final low.
Why CryptoCon Thinks Bitcoin Could Still Go Lower
The obvious counterargument is simple: if Bitcoin is already 84% through the historical average bear-market duration, why couldn’t the bottom have already happened?
CryptoCon addressed exactly that question.
He pointed out that investors could have asked the same thing during August and September in previous Bitcoin bear markets. At the time, prices appeared to have already suffered substantial corrections, yet only with hindsight did it become clear that another leg lower was coming.
That’s the main message behind his chart.
CryptoCon isn’t arguing that Bitcoin must crash simply because previous cycles did. Instead, he’s arguing that calling the bottom now requires assuming the current cycle will deviate from a pattern that has remained surprisingly consistent across previous market cycles.
He acknowledged that there is plenty of evidence supporting the bullish case. Bitcoin has recovered strongly, sentiment has improved and BTC’s roughly 25% August rally certainly doesn’t look like a market in freefall.
Still, CryptoCon isn’t betting that “this time is different” just yet.
The Bitcoin Cycle Pattern Is Surprisingly Consistent
The historical comparison becomes more interesting when looking at the duration of Bitcoin’s previous bull-market runs.
CryptoCon’s chart shows major bullish phases lasting approximately 1,080 days, 1,056 days, 1,056 days and 1,053 days.
That’s an unusually tight range considering how dramatically Bitcoin itself has changed over the past 15 years.
The returns, however, have become progressively smaller.
The earliest cycle shown on the chart produced an extraordinary gain of roughly 700,000%. The following cycle returned approximately 11,800%, followed by around 2,100% and then roughly 732% during the latest major advance.
The bear-market drawdowns have also become less severe.
Previous declines shown on the chart reached approximately 86%, 84% and 77%. The current drawdown is labeled at roughly 53%.
That could support two very different interpretations.
The bearish interpretation is CryptoCon’s: Bitcoin may simply not have completed its normal cycle yet, leaving room for another decline before the final bottom.
The bullish interpretation is that Bitcoin’s maturation has structurally reduced volatility, meaning future bear markets don’t necessarily need to repeat the 70%-plus crashes seen in previous cycles.
Read also: We Asked 3 AI Models Where Bitcoin (BTC) Price Will Be at the End of September
Does Bitcoin Really Need Another Crash?
This is where we would be more cautious about treating the chart as a prediction.
CryptoCon’s historical comparison is compelling because the timing similarities are genuinely striking. Three previous bear markets lasting 372, 384 and 417 days create a relatively narrow historical range, and the current 330-day period hasn’t reached it yet.
But averages aren’t rules.
Bitcoin today is structurally different from Bitcoin in 2014, 2018 or even 2022. Institutional ownership, spot ETFs, corporate treasury demand and the overall size of the market can potentially change how future cycles develop.
There is also no requirement that Bitcoin’s next bottom arrive exactly around day 391.
The late-October estimate should therefore be viewed as a historical-cycle projection.
CryptoCon essentially recognizes this himself. His point isn’t that a lower low is guaranteed. It’s that accepting the bottom as confirmed now would mean betting that the current cycle has broken away from the historical pattern he follows.
What Happens to Bitcoin Price in September?
September could therefore become an important test of the two competing narratives.
Bitcoin begins the month around $79,000 after a roughly 25% August rally. If BTC continues higher, establishes higher lows and eventually pushes beyond its recent major resistance, the argument that the cycle bottom has already occurred will become increasingly difficult to dismiss.
But if the August rally begins losing strength and Bitcoin turns lower again, CryptoCon’s late-cycle-bottom scenario could quickly return to focus.
The most interesting part of his analysis is therefore not a specific downside price target.
It’s the timing.
At 84% completion, his model indicates Bitcoin is already approaching the end of its historical bear-market window. Even if CryptoCon is right, the chart implies that the market could be considerably closer to a major bottom than to the beginning of another prolonged bear market.
That makes the next several weeks particularly important.
For more crypto news and price predictions on CaptainAltcoin, click here.
Subscribe to our YouTube channel for daily crypto updates, market insights, and expert analysis.