
In our last Kaspa weekly prediction, we said the bullish path depended on a break above $0.0300, which could have opened the door to $0.0318 and $0.0325.
That breakout never came. Instead, the KAS price reached the $0.0300 area before sellers pushed it lower, leaving the neutral scenario in control.
The price is now at $0.02781, up just 0.4%, but trading volume is down more than 60%. That combination points to weak conviction as traders wait for the next decisive move.
So, with KAS stuck below $0.0300 and near-term catalysts developing around the Kaspa ecosystem, here’s where Kaspa price could go this week.
What you'll learn 👉
News Pushing Kaspa Price
One development worth watching is KaChat 4.0, which expands Kaspa’s use beyond payments. The KaChat app describes itself as an encrypted peer-to-peer messaging application built directly on Kaspa, with messages and KAS payments recorded as blockchain transactions. Its latest Android update was published on August 26.
The bigger question is usage. If KaChat generates more transactions through payments, messages and its social features, that could create additional demand for KAS. For now, adoption remains the key metric to watch rather than the feature list itself.
Trading activity has also been volatile. CoinGecko data shows Kaspa (KAS) recorded $10.39 million in volume on August 28, after $10.67 million on August 27 and $16.70 million on August 26. Its market cap also moved from $817.3 million on August 28 to $775.9 million on August 29.
DAGKnight is another development on the radar. Kaspa’s development documentation describes it as a consensus upgrade designed to replace GHOSTDAG, with responsiveness to actual network latency and a planned implementation requiring a hard fork.
What Is the Kaspa Chart Showing?
We pulled up the chart, and $0.0300 is still the number to watch. The Kaspa price ran from about $0.0250 on August 19 up to roughly $0.0300 by August 21, then started bouncing around all over the place. It tried to push higher to $0.0305 on August 25, but sellers shut that down fast and knocked it back down toward $0.0270.
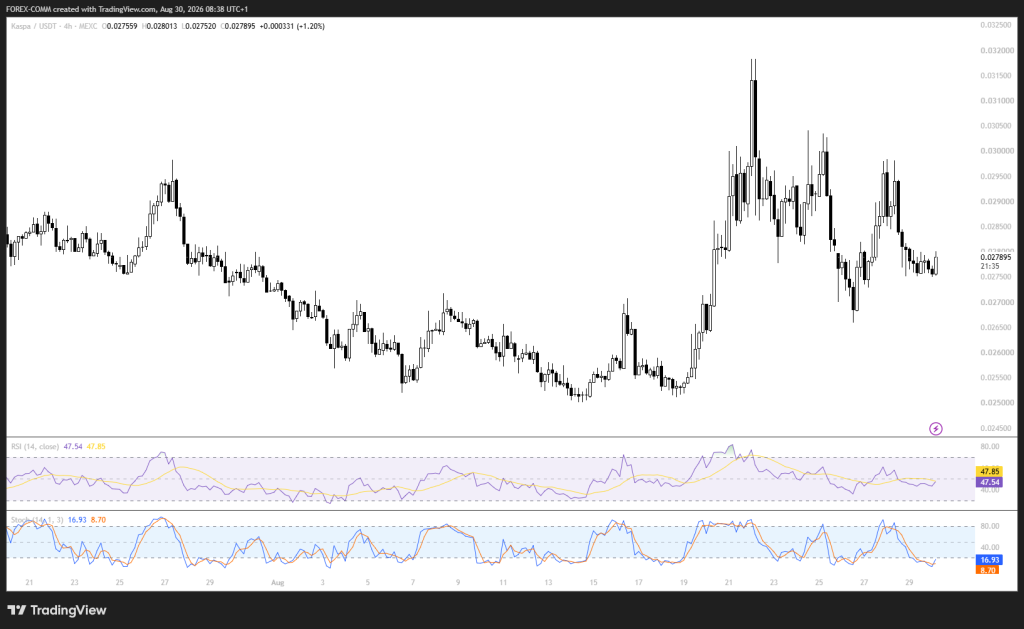
At $0.027895 on the chart, the KAS price is between the major $0.0275 support and $0.0300 resistance. A move above $0.0300 would break the recent range structure and put the August highs back into view. A loss of $0.0275, however, would expose the $0.0265 and $0.0250 zones.
The momentum readings are all over the place. RSI is at 47.54, and its moving average is 47.85, both stuck right in the middle. Not bullish, not bearish. Just nothing.
Stochastic is much weaker, down at 16.93, with the signal line at 8.70. That’s getting close to oversold, so a short-term bounce could happen. But here’s the thing, price still has to break back above resistance first before any of that matters.
Related Kaspa News: Is Kaspa Price Finally Making a Comeback? Analyst Maps the Next KAS Targets
Where Will Kaspa Price Go This Week?
Bullish path:
If Kaspa breaks clean above $0.0300, the door opens to $0.0318, then $0.0325. From the current price of $0.02781, that’s about a 14.3% move up.
Neutral path:
But if $0.0300 keeps turning buyers away, expect the KAS price to drift between $0.0275 and $0.0300. RSI is near 48, and volume is weak, so there’s no real push in either direction until buyers show up with more conviction.
Bearish path:
Now the bad side: if $0.0275 gives out, $0.0265 comes next, then $0.0250. And if that breaks too, $0.0240 to $0.0230 is the next zone down.
Frequently Asked Questions
Subscribe to our YouTube channel for daily crypto updates, market insights, and expert analysis.