Silver price is taking a break just below the psychologically important $70 level, but the way it is consolidating may be more important than the fact that resistance has not broken yet.
After trading below $63 only a few days ago, silver staged a powerful recovery toward $70. Instead of immediately giving back a large portion of those gains, the metal is now trading around $69.30 and has spent several four-hour candles sitting directly beneath resistance.
That is exactly what analyst Marco Leens is watching. In a recent post on X, Leens argued that the silver price is “doing something interesting just below $70,” pointing out that its first encounter with this major resistance area produced no meaningful rejection.
For bulls, that is an encouraging development. Buyers haven’t broken $70 yet, but sellers haven’t managed to push silver very far away from it either.
What you'll learn 👉
Silver Price Holds Firm Below $70
The four-hour chart shared by Leens shows just how quickly the market has changed.
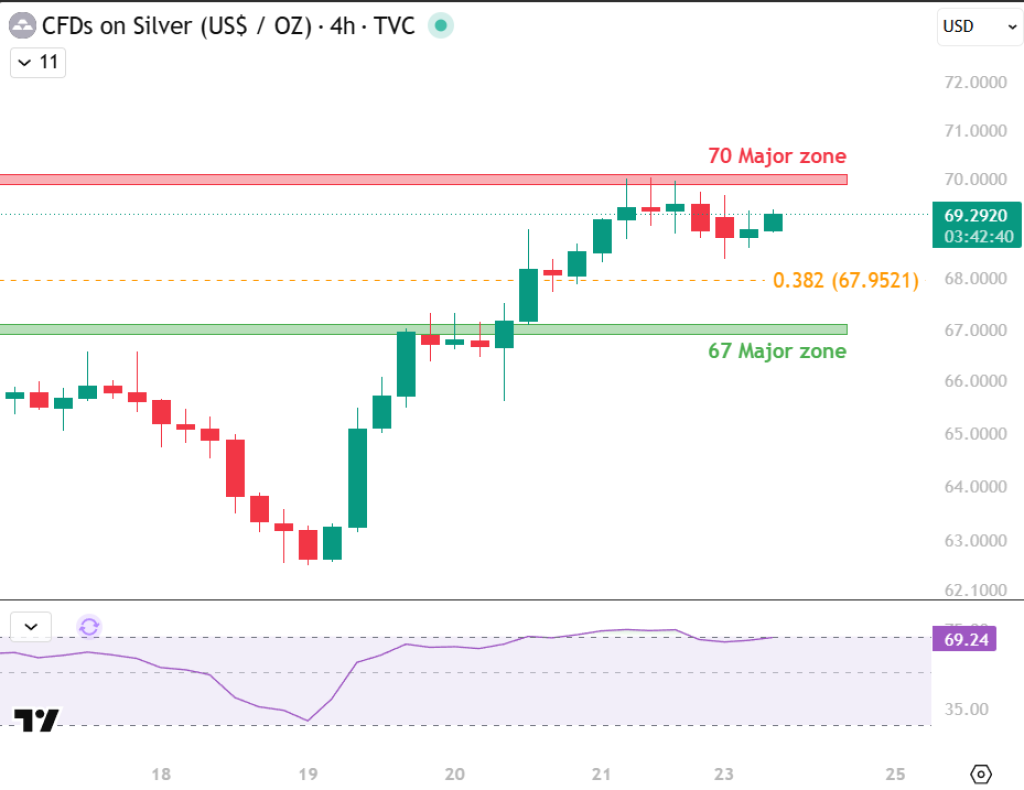
Silver fell toward approximately $62.60 on Aug. 19 before reversing heavily. It then climbed through $65, broke above the important $67 area and continued toward $70.
The first test of $70 could easily have produced aggressive profit-taking. Silver had already pumped roughly 10% from its recent low in a matter of days.
Instead, the price started moving sideways between roughly $68.50 and $70.
Leens sees that as a change in the character of silver’s price action. Rather than correcting primarily through price, the market is currently correcting through time.
That distinction is important.
A conventional correction after such a fast rally might send silver several dollars lower. Here, momentum has cooled without a comparable decline in price. Buyers are still willing to step in relatively close to the highs.
The RSI on the analyst’s chart reinforces that interpretation.
Silver’s four-hour RSI entered overbought territory during the initial surge. It has since eased to approximately 69, just below the conventional 70 overbought threshold, despite silver remaining near $69.
In simple terms, some of the technical excess created by the rally has disappeared without requiring a major selloff.
That is constructive as long as the price continues holding its recent breakout levels.
$70 Is Now the Level Silver Bulls Need to Break
There are three particularly important levels on Leens’ chart.
The first is obvious: $70.
Silver has repeatedly tested this area but hasn’t yet established itself above it. A clean four-hour breakout and subsequent hold above $70 would remove the nearest resistance and could invite another wave of momentum buying.
The second level sits around $67.95, corresponding to the 0.382 Fibonacci retracement shown on the chart.
That becomes the first meaningful downside area if the current consolidation starts breaking down.
Then comes $67, which Leens identifies as a major zone.
This level is arguably more important for the broader short-term structure. Silver recently broke above it during the rally, so a pullback that holds around $67 could simply become a retest of former resistance as support.
A decisive move back below $67 would weaken that interpretation considerably.
For now, however, silver is sitting much closer to resistance than support. That leaves bulls with a fairly straightforward question: Can silver absorb the remaining supply around $70 and finally break through?
Read also: Analyst Predicts Another Big Move for Gold and Silver Prices
Why Silver Price Could Keep Rising
The technical setup isn’t happening in isolation. Several macro and fundamental developments are providing support for precious metals.
One of the biggest catalysts came from the U.S. Treasury’s decision to double some of its long-duration debt buyback operations to at least $4 billion per transaction. The announcement initially pushed long-term Treasury yields lower, with the 30-year yield falling by nearly 10 basis points. The dollar also weakened significantly.
That combination is generally favorable for precious metals. Silver generates no yield, so falling bond yields reduce the opportunity cost of holding it. A weaker dollar can also make dollar-denominated metals more attractive to international buyers. The dollar remains near multi-month lows as markets digest the Treasury intervention and concerns surrounding U.S. debt.
Geopolitical uncertainty adds another layer.
The U.S. Strategic Petroleum Reserve is now at its lowest level since 1982.
— Honza Černý (@honzacern1) August 24, 2026
Meanwhile:
🥇 Gold: $4,638
🥈 Silver: $68.86
📈 30Y Treasury yield: 5.25%
🛢️ SPR: lowest since 1982
But don’t worry.
The economy is strong.
The system is stable.
Everything is under control. 🤡
At… https://t.co/CvXY9u1GCD pic.twitter.com/PeFRJdE1uh
Tensions surrounding Iran and the Strait of Hormuz remain elevated, with the U.S. preparing additional sanctions and Iran threatening further disruption to Gulf oil exports. Shipping through the Strait has already been heavily disrupted.
That uncertainty can increase safe-haven demand for precious metals. There is a catch, however: a prolonged energy shock could push inflation higher. If that keeps U.S. interest rates elevated, the resulting rise in yields could eventually become a headwind for silver.
Silver’s Supply Deficit Remains a Bigger Story
Beyond short-term macro catalysts, the physical silver market remains tight.
Research from the Silver Institute and Metals Focus projects a sixth consecutive annual market deficit in 2026. Their April estimate put this year’s shortfall at approximately 46.3 million ounces, up from 40.3 million ounces in 2025.
Perhaps even more striking is what has happened to inventories.
Around 762 million ounces of silver have been drawn from inventories since 2021, according to the same research. That doesn’t guarantee higher prices, but it reduces the market’s buffer if investment demand suddenly accelerates.
Physical investment has also improved. The April forecast called for coin and bar demand to rise approximately 18% this year, partly driven by recovering U.S. demand.
Those conditions provide a fundamental argument for why silver can experience unusually aggressive moves when investment flows return: new demand is entering a market that has already spent years consuming existing inventories.
What Could Stop the Silver Rally?
There are still meaningful risks.
The biggest is interest rates. The Treasury’s buybacks initially pushed long-term yields lower, but that move has already demonstrated how quickly it can reverse. Reuters reported that much of the initial bond rally was unwound the following day as inflation concerns and higher oil prices returned to focus.
If inflation accelerates and markets begin pricing higher-for-longer rates, rising real yields and a stronger dollar could put pressure on silver.
Industrial demand isn’t entirely supportive either.
The latest Silver Institute and Metals Focus estimates expect industrial silver demand to fall in 2026 amid weaker economic conditions and reduced usage in some applications. That makes silver different from gold: it benefits from monetary and safe-haven demand, but it also remains exposed to the health of the global industrial economy.
Volatility itself is another consideration. Silver’s smaller market and combination of investment and industrial demand can produce much more violent moves than gold. The recent surge from below $63 toward $70 demonstrates that on the upside, but the same characteristic works in reverse.
Supply disruptions can also normalize. Individual mines returning to production may add ounces back to the market, although the impact of a single operation is unlikely to erase a global deficit measured in tens of millions of ounces.
Silver Price Prediction: What Happens After $70?
For the immediate outlook, Leens’ chart makes the setup unusually clean.
$70 is the breakout level. $68 is the first area to watch on a pullback, and $67 is the more important support zone.
If silver continues consolidating near $69-$70 and RSI remains below its recent extreme, another attempt at $70 looks increasingly plausible. A decisive breakout could attract momentum traders who have been waiting for confirmation that the latest recovery has another leg.
Failure at $70 would not automatically turn the setup bearish. A retreat toward $68 or even a successful retest of $67 could still preserve the broader breakout structure.
The more concerning scenario would be a sustained loss of $67. That would put silver back beneath the level it worked so hard to reclaim and increase the probability of a deeper correction.
For now, though, the unusual part of this setup is what hasn’t happened. Silver rallied nearly $7 in only a few days, reached major resistance, became technically overbought, and still hasn’t suffered a serious rejection.
Subscribe to our YouTube channel for daily crypto updates, market insights, and expert analysis.