Crypto Price Prediction for Today, August 24: Bitcoin (BTC), XRP, and Solana (SOL)


The whole crypto market ticked up about 0.9% in the last day, now at $2.61 trillion. What pushed it is that big money coming back into Bitcoin.
Those spot Bitcoin ETFs pulled in roughly $1.918 billion over the week. And here’s the interesting part, Bitcoin and gold are moving almost in lockstep right now, with a 7-day correlation close to 94%. So it’s not just crypto hype. It’s the bigger picture: cheap dollars, loose money, people hedging.
The Fear & Greed Index reads 78 out of 100, solid greed territory. That means whatever happens next today could set the tone. Either BTC, XRP, and SOL keep running, or they stall out and chop sideways for a bit. We’ll know soon enough.
What you'll learn 👉
Bitcoin Price: Can BTC Hold Above $77,000?
We had a look at the chart, and the breakout structure remains bullish despite the latest decline. The BTC price is trading at $77,090, down 0.81%, after breaking above the $72,000 resistance area and climbing toward $80,000. .
The latest candles are consolidating between roughly $76,000 and $78,000, with the recent high near $79,000 acting as the main resistance.
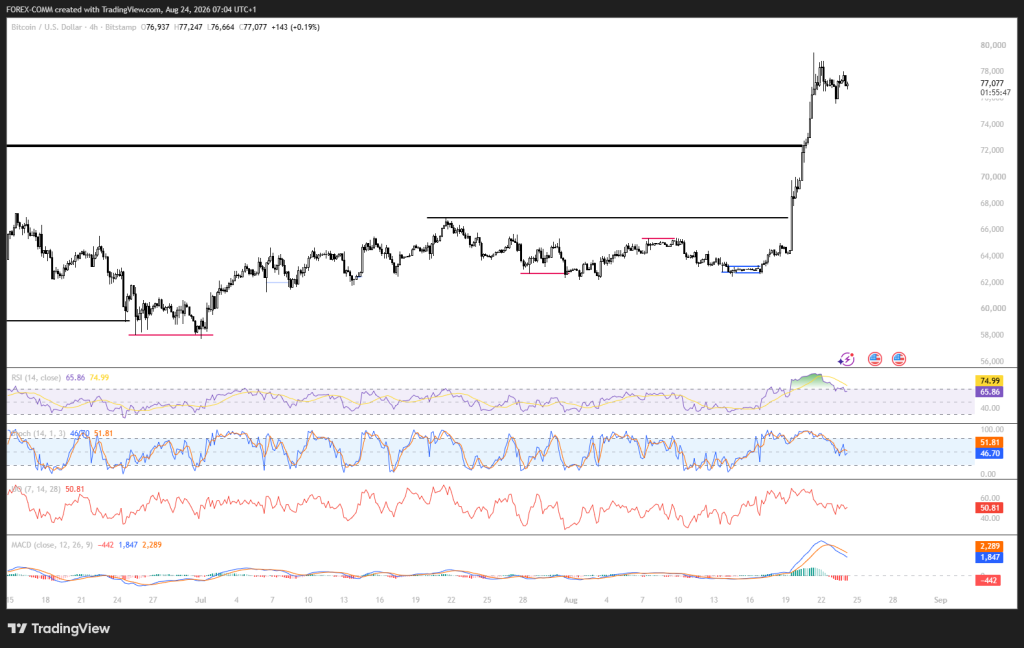
The BTC chart shows that $72,000 has changed from resistance into the first major support zone after the breakout. If Bitcoin breaks above $79,000 to $80,000, that could clear the path for fresh highs. But if it loses $72,000, the whole setup weakens, then $68,000 becomes the number to watch.
The rally still has some juice left, but it’s not as hot as it was a few days ago. The RSI is at 65.92, below the 70 line that usually means “too hot, too fast.” The STOCH indicator reads 47.44, and the Ultimate Oscillator is around 45.19. Both point to softer short-term buying pressure. That said, the MACD stays positive at 1,849, so the bigger trend still leans bullish for now.
| Indicator | Reading | Signal |
|---|---|---|
| RSI | 65.92 | Bullish |
| STOCH | 47.44 | Neutral |
| Ultimate Oscillator | 45.19 | Neutral |
| MACD | 1,849 | Bullish |
What Is Moving the Bitcoin Price Today?
The Bitcoin price is still supported by the U.S. Treasury’s plan to double long-dated bond buybacks to at least $4 billion per operation, which initially pushed longer-term yields and the dollar lower.
Spot Bitcoin ETFs then recorded about $1.92 billion in weekly inflows, giving institutional demand its strongest week since October 2025. (Reuters)
Bitcoin dominance remains near 59.12%, showing that capital has not moved heavily into altcoins, while perpetual open interest increased 5.62% and 24-hour liquidations were about $66.94 million.
Mining difficulty has also fallen roughly 19% from its November 2025 peak of about 156T, reaching around 125.8T, while corporate treasury purchases such as Metaplanet’s 775 BTC and Strategy’s 430 BTC add to the broader institutional demand picture. (Maketo)
Bitcoin Price Prediction for Today
Bullish Prediction:
A break above $79,000 – $80,000 could push the Bitcoin price toward $82,000 – $84,000.
Neutral Prediction:
BTC could consolidate between $72,000 and $79,000.
Bearish Prediction:
A break below $72,000 could expose $68,000, followed by $66,000.
Ripple’s XRP Price: Can XRP Reclaim $1.55?
We had a look at the chart, and the structure remains bullish after an unusually fast move from around $1.00 to $1.70. XRP is trading at $1.4773, down 2.90%, with the latest candles consolidating around $1.45 – $1.55 after rejection near $1.70. The chart shows $1.55 as the first resistance, followed by the recent high around $1.70.
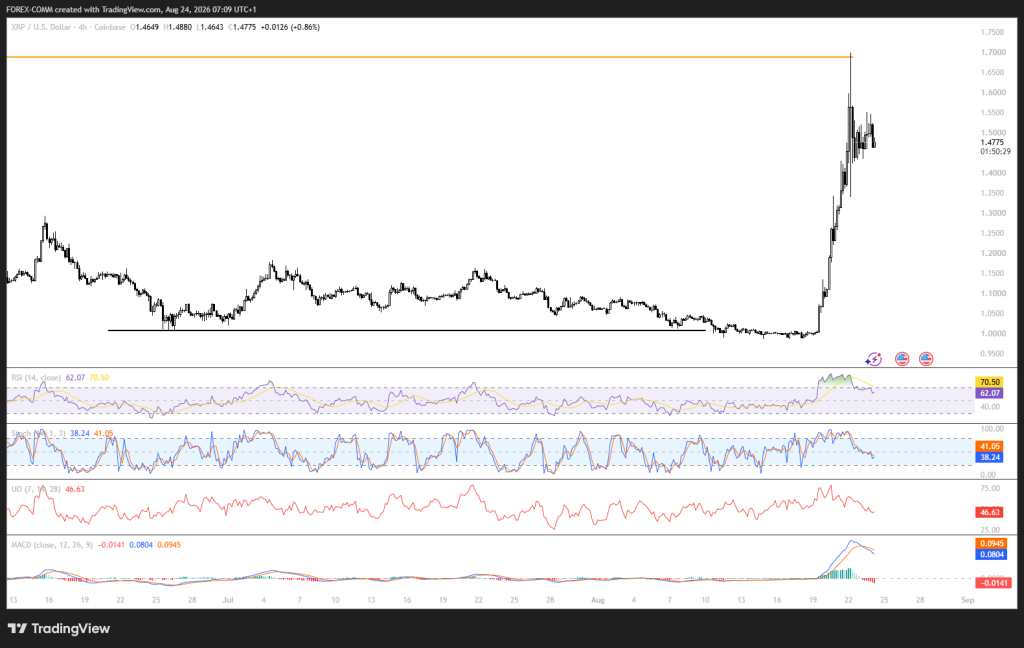
The breakout has moved XRP well above its previous trading range, but the price needs to hold the $1.40 – $1.45 area to keep the structure intact. A move through $1.55 would put $1.70 back in play, whereas losing $1.40 could send the XRP price toward the $1.30 – $1.35 breakout zone.
The indicators show that momentum is still positive but cooling. RSI is 62.07, STOCH is 38.07, and the Ultimate Oscillator is 46.30, while MACD remains positive at 0.0802, leaving the broader setup bullish but with weaker short-term buying pressure.
| Indicator | Reading | Signal |
|---|---|---|
| RSI | 62.07 | Bullish |
| STOCH | 38.07 | Neutral |
| Ultimate Oscillator | 46.30 | Neutral |
| MACD | 0.0802 | Bullish |
What Is Moving the XRP Price Today?
XRP’s circulating supply increased 5.5% year over year, and XRPL revenue fell 81.6% to $1.18 million in H1 2026, creating a supply-demand problem for holders; U.S. XRP ETPs absorbed less than 15% of the new supply.
The XRP price still has strong short-term support from its breakout toward $1.70, with the $1.35 area acting as an important technical support zone.
Ripple is also backing an institutional credit fund with Clearpool and Cicada Partners that plans to use RLUSD for lending on XRPL, although the product is still on development infrastructure and requires validator approval before mainnet use.
Related XRP News: We Asked 3 AI Models If XRP Price Can Ever Reach $100
XRP Price Prediction for Today
Bullish Prediction:
A break above $1.55 could send the XRP price toward 1.65–1.70.
Neutral Prediction:
Ripple’s XRP price could remain between $1.40 and $1.55.
Bearish Prediction:
Losing $1.40 could expose $1.35, followed by $1.30.
Solana Price: Will SOL Hold $90 After Its Rally?
We had a look at the chart, and SOL is trading at $94.18, down 1.3% from its recent highs. The token climbed from around $76 to above $102 in only a few sessions, pushing through the important $84 resistance.
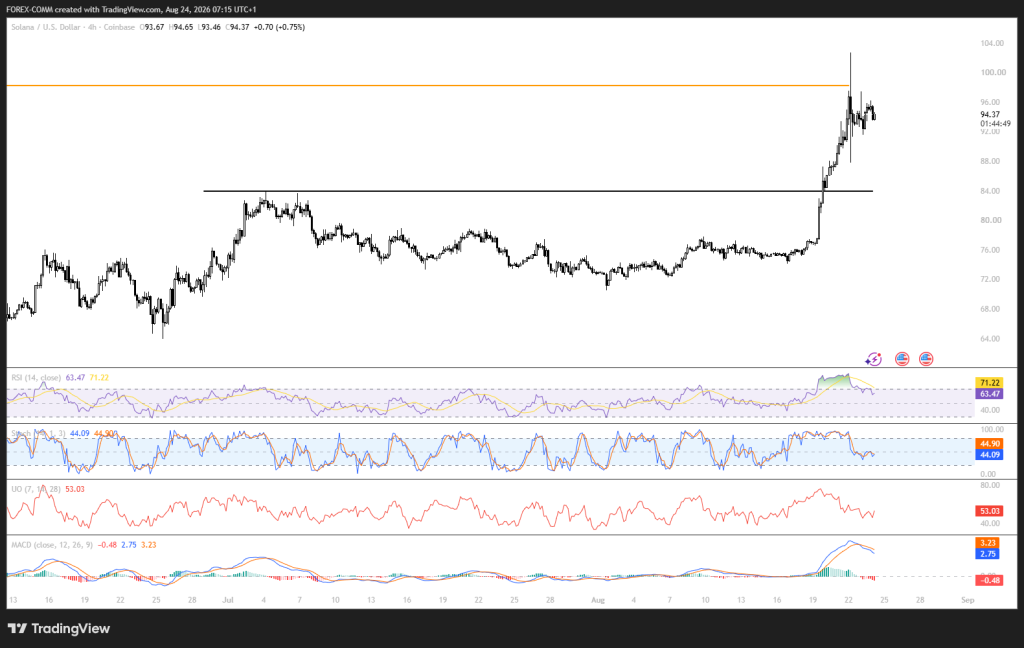
Buyers are still holding the line above $90. That much is clear from the latest price action. But the punch from that first breakout? It’s faded a bit.
Next big hurdle is $98. Above that, you’ve got the recent peak around $102 – $103. If the SOL price can stay above $90 and push back through $98, then another run at $102 makes sense. If it drops, first support is $90, then $84 below that.
The momentum gauges tell a similar story, still positive, but cooling off. RSI reads 63.02. That’s bullish territory, but well under the 70 mark that screams “overheated.” STOCH is down at 43.22, and the Ultimate Oscillator is at 52.52.
Both point to weaker buying pressure in the short term. The MACD, though, stays positive at 2.75. So the bigger trend hasn’t cracked yet.
| Indicator | Reading | Signal |
|---|---|---|
| RSI | 63.02 | Bullish |
| STOCH | 43.22 | Neutral |
| Ultimate Oscillator | 52.52 | Bullish |
| MACD | 2.75 | Bullish |
What Is Moving the SOL Price Today?
Solana validators are voting on SGP-0002, which would raise the annual disinflation rate from 15% to 30% and reduce projected six-year supply by 18.9 million SOL, worth about $1.81 billion at the stated valuation.
The proposal could reduce dilution, but lower staking yields and opposition from some validators make the outcome uncertain.
Institutional demand remains positive, with Solana ETFs recording $28.34 million in weekly inflows for an eighth consecutive week.
The bullish flow is facing a hedge from Wintermute, which has about $190.77 million in total Hyperliquid shorts, including a $22.62 million SOL short, creating a clear source of potential selling pressure if SOL fails to break $100.
Solana Price Prediction for Today
Bullish Prediction:
A break above $100 could push the SOL price toward 103–105.
Neutral Prediction:
SOL could consolidate between $90 and $100.
Bearish Prediction:
A break below $90 could send the Solana price toward $84 – $85.
Frequently Asked Questions
Subscribe to our YouTube channel for daily crypto updates, market insights, and expert analysis.