
Gold price has enjoyed an extraordinary few weeks, but one analyst believes the rally may now be running a little too hot.
Gold gained around 2% in its latest session and pushed above $4,600 per ounce, extending a big recovery from below $4,000 in late July. The metal has gained more than 11% over the past month, and today’s move took it to its highest level in more than three months.
That makes the speed of the recovery particularly impressive. Gold has gone from struggling near the $4,000 area to trading above $4,600 in only a few weeks. The latest leg accelerated after the U.S. Treasury announced an expansion of its long-term debt buyback program, initially pushing Treasury yields and the dollar lower and giving precious metals another catalyst.
However, after such a fast move, technical analyst Fthegurus believes gold may need a cooldown before making another attempt higher.
What you'll learn 👉
Gold Price RSI Is Getting Hot
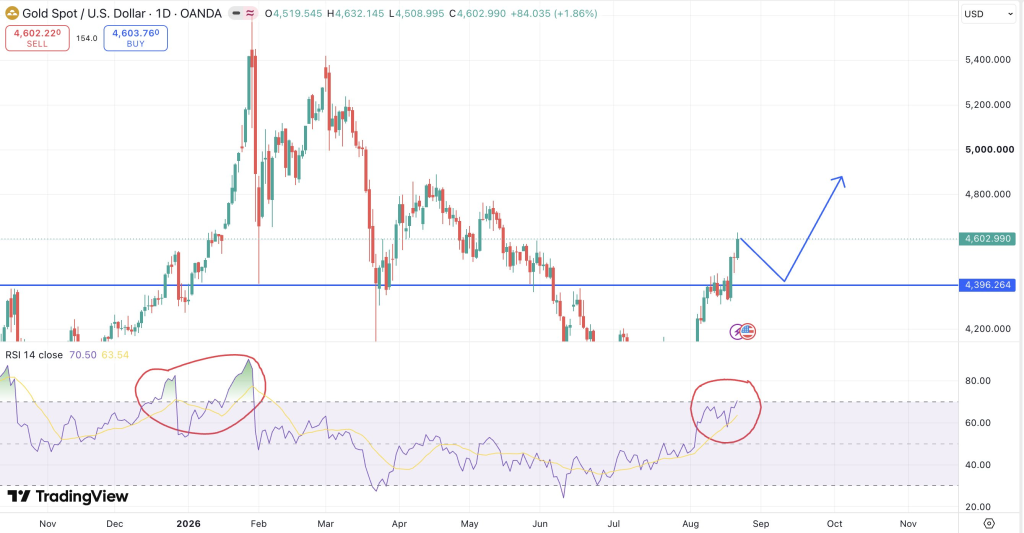
In a post on X, Fthegurus pointed to gold’s daily Relative Strength Index (RSI), which is approaching its most overbought territory since January.
His chart puts the current RSI at roughly 70.5. An RSI above 70 is commonly considered overbought, although that does not automatically mean the price is about to fall. Strong trends can remain overbought for extended periods.
The important part of his analysis is the comparison with January.
The chart circles two periods. The first occurred around late January, when the RSI pushed deep into overbought territory as gold accelerated toward its record highs. That rally eventually became exhausted, and gold entered a much larger correction.
The second circle marks the current setup. RSI has once again climbed rapidly toward the overbought zone following gold’s August surge.
Fthegurus therefore called the setup a “warning sign,” arguing that traders should not automatically extrapolate the recent rally straight toward the increasingly popular $6,000 target.
There is an important distinction here: the analyst isn’t calling for the end of the gold rally. He is essentially arguing that gold may need to correct before moving higher again.
Could Gold Price Retest $4,400?
The most important price on the analyst’s chart is approximately $4,396, which corresponds closely with the $4,400 support area mentioned in his post.
His preferred scenario has gold pulling back from around $4,600 toward $4,400. Such a move would amount to a correction of only about 4%-5% from current levels, relatively modest considering how quickly gold has risen.
More importantly, a pullback could allow the daily RSI to fall back toward neutral territory without destroying the broader recovery.
The chart illustrates exactly that scenario: gold falls toward the former $4,400 resistance area, holds it as support and then begins another leg higher.
That would also create a classic breakout-and-retest structure. Gold spent considerable time struggling around this area before eventually moving above it. If buyers defend $4,400 during a correction, former resistance could become new support.
Fthegurus sees that potential reset opening the door to another advance by late September, with $5,000 per ounce becoming the next major objective.
From around $4,600, reaching $5,000 would require another gain of roughly 9%.
Read also: Gold Price Prediction: Here’s Where Gold Could Go After Breaking $4,574
A Pullback Wouldn’t Necessarily Be Bearish
This is arguably the most useful takeaway from the chart.
After moving from below $4,000 in late July to above $4,600, some profit-taking would hardly be surprising. A market cannot continue rising vertically forever, and overbought conditions become more relevant when they emerge after an unusually rapid advance.
The bullish structure would look considerably healthier if gold consolidated or retested the breakout area and buyers stepped back in around $4,400.
Conversely, a decisive loss of that zone would make the setup less convincing. It would put gold back below an important breakout level and raise the possibility that the August surge had moved too far, too quickly.
For now, however, momentum remains firmly on the side of buyers. Gold’s recent breakout was also supported by a softer U.S. dollar and technical momentum, with Reuters reporting that bullion was heading for a third consecutive weekly gain.
Why Is Gold Price Going Up?
The rally isn’t being driven by technical factors alone.
One of the biggest catalysts arrived when the U.S. Treasury announced plans to double the size of some long-dated debt buyback operations. Long-term Treasury yields initially dropped heavily after the announcement, and the dollar weakened. Gold jumped more than 3% in response.
That relationship matters because gold does not pay interest. Lower bond yields reduce the opportunity cost of holding bullion, and a weaker dollar makes dollar-denominated gold cheaper for buyers using other currencies.
There is also a broader fiscal angle. U.S. government debt has moved above $40 trillion, and the Treasury’s intervention in the long-term bond market has added to the debate around fiscal sustainability and currency debasement. Those concerns can increase demand for gold as a store of value.
The next question is whether those macro forces are powerful enough to keep gold elevated even as its short-term technical indicators become stretched.
For now, Fthegurus’ chart offers a more measured scenario than the $6,000 calls circulating after the latest rally: $4,600 does not necessarily have to lead directly to $5,000. A return toward $4,400 could come first.
For more gold news and price predictions, click here.
Subscribe to our YouTube channel for daily crypto updates, market insights, and expert analysis.