


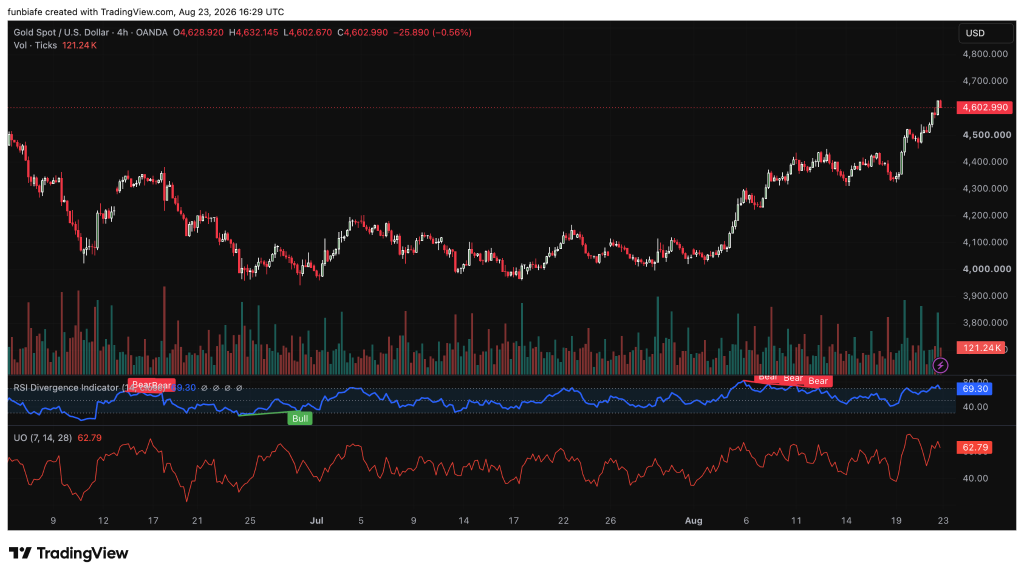
Gold starts the week with bullish momentum, the price is heading into the new week around $4,603 after climbing from the $3,800 area reached in June. We had a look at the XAU/USD chart, and buyers still have the upper hand, even though gold ran into selling pressure around $4,600-$4,632.
Gold reached $4,632 before easing back to $4,602.99. That move shows sellers are defending the area, but the price is still above the $4,500 breakout level.
Trading volume also picked up during the August rally. The increase in activity came as gold moved through $4,400 and $4,500, giving the breakout stronger support than the quieter price action seen in June and July.
What you'll learn 👉
The Key Levels Gold Must Break Next
Gold’s first test is $4,632. Clear that and hold, and $4,700 is next, then $4,800. But there’s a yellow flag. RSI is at 69.30, just under 70. That’s the overbought line. The Ultimate Oscillator is at 62.79, so momentum is still on the bullish side. Gold could go higher, but it might need to pause first.
Key support is $4,500. Stay above that, and the bullish setup stays intact. Drop below $4,400, and things get shaky, $4,300 comes into play. Break above $4,632, and bulls have a clear path to $4,700. Take that out, and $4,800 is the next stop.
From around $4,603, that would give the gold price room for another $100 to $200 in upside this week. The chart supports that possibility, but buyers need to clear $4,632 first. If gold fails at that resistance, the market could spend more time around $4,500 before the next major move.
Read Also: Crypto Price Prediction for Today, August 23: Solana (SOL), XRP, and Ethereum (ETH)
What Could Push Gold Toward the Bullish Target?
The options market is giving bulls another reason to stay interested. Data shared by Coin Bureau from Barchart shows gold call-option demand at its highest level in six months. The chart shows call-put open interest rising to about 2.5 million contracts, well above the 1 million baseline recorded between 2021 and 2024.
Heavy demand for call options can lead dealers to hedge their positions by buying the underlying asset. That can add buying pressure if the gold price keeps climbing. The options data also lines up with the technical picture, as gold has broken above $4,500 at the same time that bullish positioning in the options market has increased.
The main level to watch on the downside is $4,500. If gold loses that support, the breakout loses its punch. Then $4,400 becomes the next level to watch. Break that, and $4,300 comes into play.
With RSI flirting with 70, traders shouldn’t be surprised if gold takes a breather or dips before making another run. The big question this week is simple: can gold break $4,632 and hold it? If it does, $4,700 and $4,800 are next. If buyers can’t clear resistance, then $4,500 becomes the level that really matters for what happens next.
FAQs
Subscribe to our YouTube channel for daily crypto updates, market insights, and expert analysis.






