
SUI, XRP, and Polygon are taking 3 very different paths this August 18. One is testing a price floor that has survived for years, another is struggling around a familiar psychological barrier, and the third is trying to protect a powerful recovery.
Their technical indicators make today’s setup even more interesting. Oversold conditions, weak momentum, and growing buying pressure are pulling the 3 tokens in separate directions.
A closer look at the charts reveals which cryptocurrency has the strongest setup and which one faces the greatest downside risk today.
What you'll learn 👉
SUI Price Tests a Major Support Zone After Falling Toward $0.63
SUI price has dropped from $0.67 toward $0.63 today. The token currently trades near $0.64, which places it close to an important historical support area.
The $0.66 level had prevented deeper losses since August 2024. SUI has now moved below that price, and a daily close under $0.66 would create a new low. Such a close could leave the token exposed to further losses over the coming days.
A look at the SUI chart shows that $0.63 may offer temporary support. Buyers could attempt a recovery from this area, although reclaiming $0.63 alone would not return SUI to a bullish position.
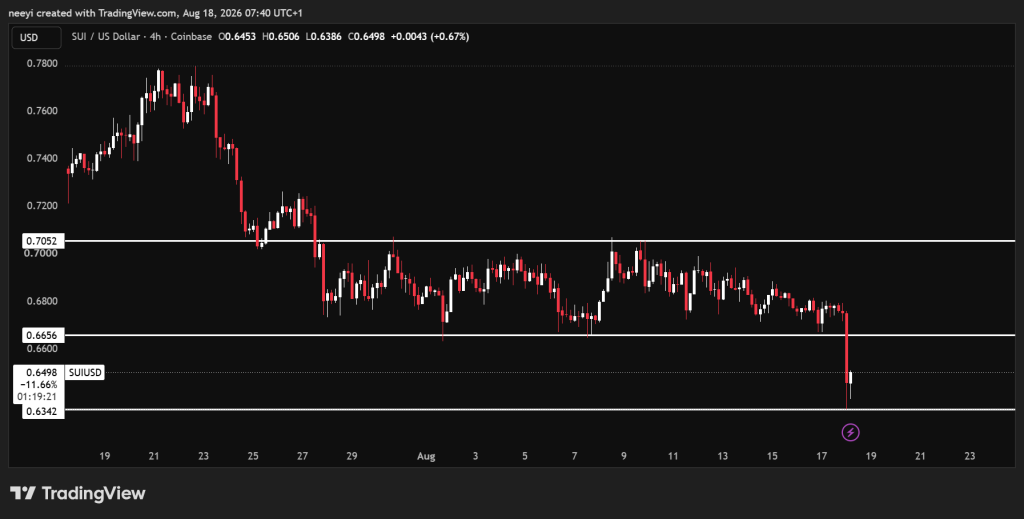
SUI price could remain between $0.63 and $0.66 throughout August 18. A successful recovery above $0.66 could open the way toward $0.69, although current momentum makes that outcome less likely. Failure to defend $0.63 would increase the risk of a deeper decline.
The technical indicators explain why SUI remains vulnerable. The RSI reading of 26.352 places SUI inside oversold territory. This condition can sometimes precede a brief recovery, but it does not confirm that the decline has ended.
The stochastic reading of 64.719 provides the only positive signal. Short term buying pressure may still support an attempt to recover from $0.63.
The MACD remains negative at minus 0.007. Bearish price momentum therefore remains active despite the oversold RSI. The ADX reading of 33.37 confirms that the current price trend has enough strength to continue.
| Indicator | Reading | What the Reading Means |
|---|---|---|
| RSI (14) | 26.352 | Oversold conditions may support a brief recovery |
| Stochastic (9,6) | 64.719 | Short term momentum remains positive |
| MACD (12,26) | minus 0.007 | Bearish momentum remains active |
| ADX (14) | 33.37 | The current downward trend has moderate strength |
XRP Price Could Remain Trapped Between $0.98 and $1
XRP price has continued its gradual decline and recently touched the $0.98 area. The token is now trying to retest the broken $1 support as resistance.
That retest could determine the XRP price direction throughout August 18. Failure to recover above $1 would leave $0.98 exposed to another test. Losing $0.98 could push XRP toward $0.97 before the end of the day.
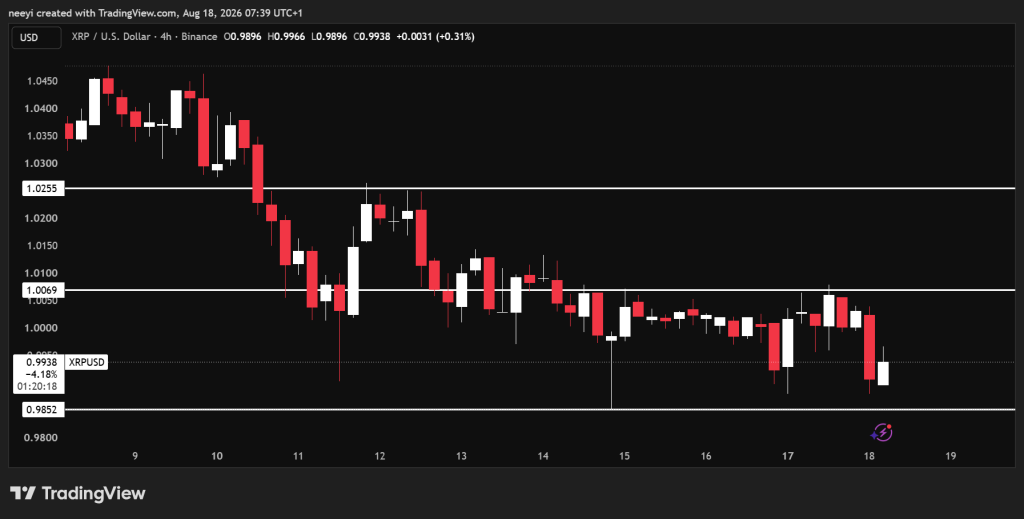
A clean move above $1 would improve the short term outlook. XRP could then reach $1.02 if buyers maintain enough pressure. Current conditions still support a neutral scenario between $0.98 and $1, especially if market momentum remains unchanged.
The RSI reading of 39.943 places XRP below the neutral 50 mark. Sellers currently have more control, although XRP has not entered deeply oversold territory.
The stochastic reading of 54.445 offers a neutral view. Short term momentum lacks a clear direction, which supports the possibility of continued range trading near $1.
The MACD reading of minus 0.005 confirms weak bearish momentum. XRP may struggle to reclaim $1 unless that indicator improves. The ADX reading of 36.412 shows that the existing downward trend carries reasonable strength.
| Indicator | Reading | What the Reading Means |
|---|---|---|
| RSI (14) | 39.943 | Sellers retain control below the neutral zone |
| Stochastic (9,6) | 54.445 | Short term momentum lacks clear direction |
| MACD (12,26) | minus 0.005 | Bearish momentum remains present |
| ADX (14) | 36.412 | The existing downward trend remains firm |
Polygon Price Targets $0.089 After Its Recent 13% Increase
Polygon price offers a stronger setup than SUI and XRP today. POL climbed by almost 13% yesterday before giving back part of that increase.
The $0.08 area remains an important barrier for Polygon. A decisive move above this level could carry POL toward $0.089 under calmer conditions. Stronger buying pressure could eventually produce a move toward $0.096.
Downside risk has not disappeared. Failure to defend support near $0.078 could send the Polygon price toward $0.075. A neutral outcome would keep POL between $0.079 and $0.084 for the remainder of August 18.
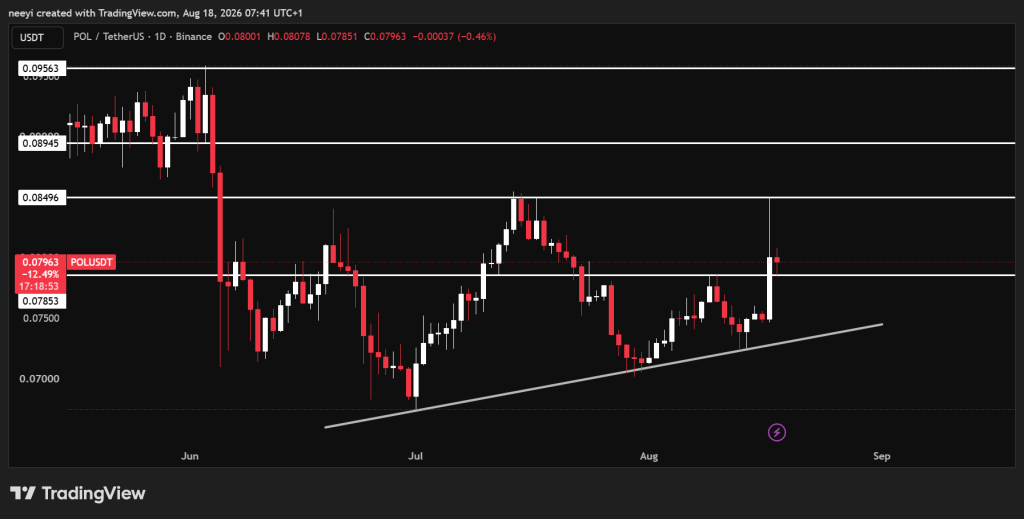
Polygon’s RSI reading of 71.267 shows strong buying pressure, but it also places POL inside overbought territory. Buyers remain in control, although the elevated reading increases the chance of further profit taking.
The stochastic reading of 35.94 points toward weaker short term momentum. That reading may explain why POL retraced after its earlier increase.
The MACD remains positive at 0.001, which supports the possibility of another upward attempt. The ADX reading of 45.397 confirms that Polygon’s current trend carries considerable strength.
| Indicator | Reading | What the Reading Means |
|---|---|---|
| RSI (14) | 71.267 | Strong demand has pushed POL into overbought territory |
| Stochastic (9,6) | 35.94 | Short term momentum has started weakening |
| MACD (12,26) | 0.001 | Positive momentum still supports buyers |
| ADX (14) | 45.397 | The current price trend remains strong |
FAQs
Subscribe to our YouTube channel for daily crypto updates, market insights, and expert analysis.