In our last Bitcoin price prediction, we laid out three ways this could go when BTC was hanging around $63,300 to $63,500.
If bulls held that area, they needed to take back $64,400 and $65,200 first, then go for $66,800. If nothing happened, BTC just chops between $62,700 and $65,200. If bears won and $62,700 broke, then $62,400 and $62,000 were next.
Bitcoin did find buyers near $63,300. That part worked. But the CPI number came out, and instead of breaking out, BTC got pushed back under $64,000. So here we are. Right now, the Bitcoin price is at $63,346. Down 0.3% on the day. Volume is up 8%, so people are watching.
Now we have more news coming. PPI. Jobless claims. Some new institutional moves. Any of those could decide where Bitcoin goes from here.
What you'll learn 👉
What Could Move Bitcoin Price Today?
The next major macro event is the U.S. Core PPI, with the forecast at 0.2% versus 0.3% previously. Headline PPI is also expected at 0.2%, compared with -0.3% previously. Initial unemployment claims are forecast at 202,000 versus 199,000.
A softer PPI reading could improve expectations for lower interest rates and help risk assets, giving BTC room to reclaim $64,400. A hotter result could produce the opposite reaction by keeping rate concerns elevated.
Institutional developments provide another data point. Goldman Sachs agreed to acquire NEOS Investments for up to $2.25 billion, and NEOS manages BTCI, a $1.1 billion fund that uses spot Bitcoin ETPs and covered calls. The deal gives Goldman a larger position in crypto-related investment products.
Bitcoin ETF demand also remains constructive. U.S. spot BTC ETFs recorded roughly $854 million in net inflows across five trading days, their strongest weekly inflow since April, with BlackRock’s IBIT accounting for about 80% of the total. That demand gives the Bitcoin price a source of buying pressure, but Tether’s USDT supply has contracted by roughly $4 billion over 60 days, creating a counterweight for crypto liquidity.
Here’s What the Bitcoin Chart Is Showing
We had a look at the chart, and the $63,000 area remains important. The BTC price rallied from the late-June low near $58,000, then established higher levels through July before reaching almost $67,000–$67,000 around July 21–22.
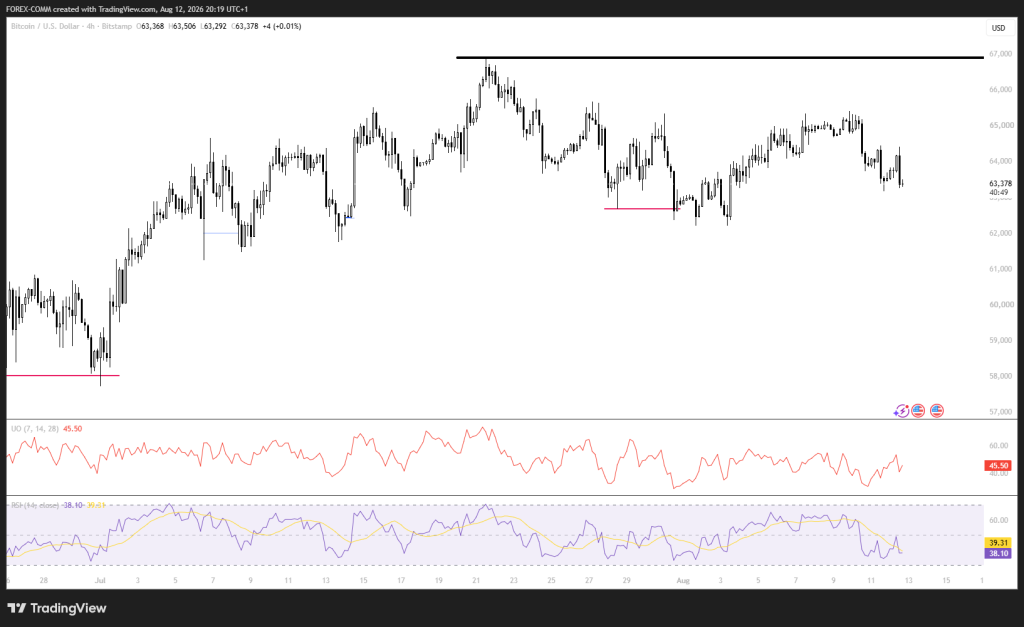
See that black horizontal line across the chart? That is $67,000. Bitcoin has tried to break through it more than once. It keeps failing.
After that peak in July, the BTC price came down to that red line near $62,700. Then it bounced back up toward $65,000. The red line got tested again at the end of July and again in early August. Every time, buyers showed up. So $62,700 is starting to look like a real floor for now.
The latest candles tell you what has happened lately. BTC dropped from around $65,000 down to $63,378. The last candle opened at $63,368, ticked up to $63,506, dipped to $63,292, and closed near $63,378. That puts Bitcoin right back under that $64,400 level we talked about before. Still stuck.
Momentum indicators also lean cautious. The Ultimate Oscillator is at 45.50, below the 50 midpoint. The RSI is at 38.10, below its 50 midpoint and close to the lower end of its recent range. That gives bears an advantage, but RSI has not reached the 30 oversold threshold.
Related Bitcoin News: Crypto News Today: SEC Blockchain Trading Push Meets Bitcoin Rejection as CPI Holds at 3.4%
Where Will Bitcoin Price Go Next?
For Bitcoin to turn bullish, it has to hold $63,000 to $63,300 first. Then it needs to take back $64,400. If it clears $65,200 after that, $66,000 to $67,000 opens up. But $67,000 is the big one. That is the wall.
If nothing much happens, we stay in the range. $62,700 on the low end, $65,200 on the high end. That is the most realistic outcome if PPI comes and goes without causing any real chaos.
The bearish case only starts if $62,700 breaks. Once that goes, $62,000 is next for the BTC price. And if sellers keep piling on, we are looking at that July low near $58,000.
So here is the bottom line. Bears need to break $62,700. Bulls need to take back $64,400. Those are the two lines to watch.
Frequently Asked Questions
Subscribe to our YouTube channel for daily crypto updates, market insights, and expert analysis.