
Gold holders should have nothing but smiles on their faces in the past 10 days or so. The price pumped from around $4,000 to roughly $4,400 at press time – a 10% move, which is a big pump for gold.
The metal has been on a strong recovery run, breaking out of a multi-month base and testing key resistance levels. The question now is whether the gold rally has legs or if sellers will step in near the 200-day moving average.
What you'll learn 👉
Retail Investors Are Rushing Back Into Gold
The Kobeissi Letter reported a big change in retail sentiment.
The largest US physical-gold-backed ETF, GLD , attracted +$50 million in retail inflows on Wednesday , the largest daily inflow since March. That was also twice the previous largest daily inflow recorded since early April.
Overall, GLD attracted +$637 million in inflows on Wednesday , the largest daily inflow since June 18. The fund then posted +$77 million and +$431 million in inflows on Thursday and Friday, respectively.
Retail investors are rushing back into gold:
— The Kobeissi Letter (@KobeissiLetter) August 11, 2026
The largest US physical-gold backed ETF, $GLD, attracted +$50 million in retail inflows on Wednesday, the largest daily inflow since March.
This was also twice the previous largest daily inflow recorded since early April.
Overall,… pic.twitter.com/3LHL9IPATB
So far in August, investors have added +$1.4 billion to GLD, putting the ETF on track for its first monthly inflow since February.
Investor appetite for gold is back.
Gold Chart Analysis – Weekly Timeframe
The weekly gold chart tells a story of a market that blew off, corrected, and is now recovering.
January 2026 began with consolidation between roughly $4,300 and $4,450, a fairly tight base to start the year. Late January brought a violent, fast spike to a high near $5,600 , followed almost immediately by an equally violent crash back down to roughly $4,400 within days. This is a classic blow-off and flush pattern – likely a news-driven spike or flash event, not organic trend continuation.
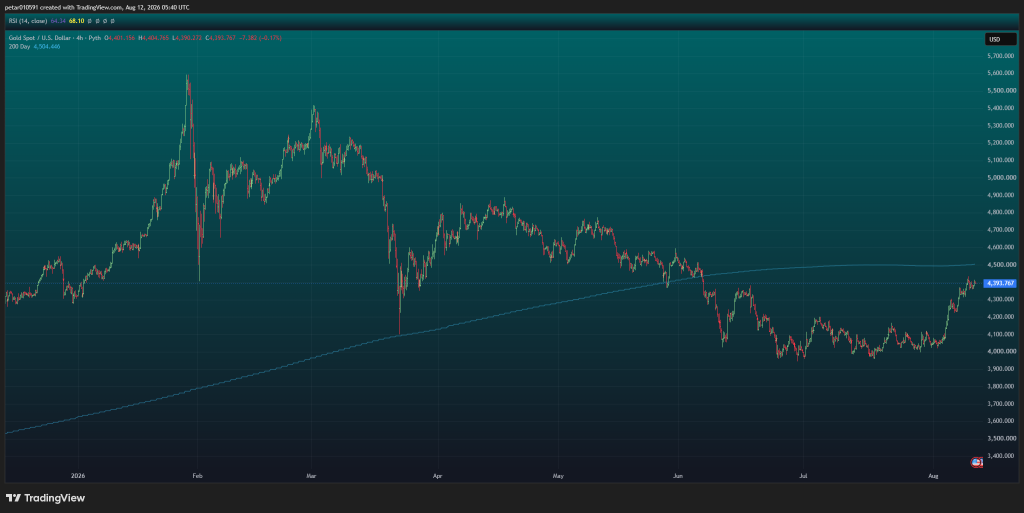
February to March saw a choppy rally back toward roughly $5,400–$5,450, failing to reclaim the January highs – a lower high versus the initial spike. April brought a sharp decline from roughly $5,300 down to a swing low near $4,100 , another fast capitulation-style drop.
April to May produced a bounce back to roughly $4,900, then rolled over again. May to June had a steady grind down to a range low around $4,000–$4,050. June to July featured extended consolidation between roughly $4,000–$4,200 – the longest sideways base on the chart, building a floor.
Late July to August has brought a strong recovery push from roughly $4,050 back up to current price $4,393.77 , breaking back above the long-term rising trendline in the process.
Gold price: key Levels:
- Current price: $4,393.77 (down -0.17% on the day)
- 200-day MA: $4,504.45 – sitting above current price, making it the key overhead resistance. Price has not reclaimed this since the June breakdown.
- Rising trendline (light blue): Drawn from the January base through the multi-month decline, currently sitting almost exactly at and just below current price. Price is testing and reclaiming this trendline as support after spending May to July below it.
- Immediate resistance: $4,450–$4,500 zone (January consolidation range + 200-day MA confluence)
- Support: $4,200–$4,300 (recent breakout base), then $4,000–$4,100 (the June range floor)
The chart’s dominant story right now: price has clawed back above its rising trendline and is pressing into the 200-day MA – a genuine test of whether the broader downtrend since February is over.
Read also: Gold and Silver Prices Post Their Strongest Week in Months: What to Expect Next
Weekly Indicator Panel
| Indicator | Value | Signal | Interpretation |
|---|---|---|---|
| ADX (14) | 40.73 | Buy | Strong trend in place |
| Williams %R | -45.76 | Neutral | Mid-range – no extreme |
| CCI (14) | 42.80 | Neutral | No strong momentum extreme |
| ATR (14) | 221.85 | Less Volatility | Weekly ranges have compressed |
| Highs/Lows (14) | 30.79 | Buy | Higher highs and higher lows |
| Ultimate Oscillator | 59.96 | Buy | Buying pressure across multiple timeframes |
| ROC | -6.80 | Sell | Negative rate of change – lagging from earlier decline |
| Bull/Bear Power (13) | 170.87 | Buy | Bulls in clear control |
Aggregate read: 5 of 8 indicators lean Buy, 2 are Neutral, and only ROC is flatly bearish. That ROC “Sell” is worth flagging – it is a lagging reflection of the multi-month drawdown from the January highs rather than a signal about current momentum, since every other momentum and trend metric is already flipping bullish.
Gold Price Prediction (Short-Term)
The chart and the weekly indicators tell a fairly consistent story. The gold price spent February through June in a corrective downtrend after the January blow-off and crash, found a base around $4,000–$4,100, and has staged a genuine recovery back above its rising trendline.
The weekly indicator panel largely confirms this – strong trend strength (ADX), broad-based buying pressure (Ultimate Oscillator, Bull/Bear Power), and a pattern of higher highs and higher lows – with the lone bearish holdout (ROC) reflecting stale medium-term weakness rather than current conditions.
The key test ahead is the 200-day MA at $4,504. Reclaiming and holding above that level would confirm the recovery has real strength and could open the way back toward the $4,700–$4,900 zone. Failure there, combined with the “Less Volatility” ATR reading (often a precursor to a volatility expansion in either direction), keeps a rejection back into the $4,200–$4,300 base a real possibility.
Bullish scenario: Gold breaks and holds above $4,500. Next targets are $4,700 and then $4,900. The retail inflows and ETF demand support this view.
Neutral scenario: Gold consolidates between $4,300 and $4,500. A pause to digest the 10% rally would be healthy. This is the most likely outcome in the short term.
Bearish scenario: Gold fails at the 200-day MA and drops back toward $4,200–$4,300. A break below $4,200 would open the door to $4,000.
Overall, the $4,500 level is the line in the sand. The gold price has not closed above the 200-day MA since June. A break above that level would be the strongest bullish signal in months. A rejection would send gold back toward $4,200.
For gold and crypto news and price predictions from CaptainAltcoin, click here.
Subscribe to our YouTube channel for daily crypto updates, market insights, and expert analysis.