Crypto Price Prediction for Today, August 10: XRP, Ethereum (ETH) and Bitcoin (BTC)


The crypto market is showing a little life today, with the total market cap up 0.35% and moving at $2.2 trillion. The Bitcoin price remains around the mid-$65,000 area as ETF demand gives the market some support, although whale selling and fresh Bitcoin-backed borrowing are keeping traders cautious.
XRP is still struggling below key resistance, whereas Ethereum has stronger momentum across its indicators.
With buyers and sellers still fighting for control, today’s price action could determine whether the market extends its recovery or faces another wave of selling.
What you'll learn 👉
XRP Price Tests $1.03 as Weak Momentum Keeps Bulls Cautious
Ripple’s XRP is going for $1.03 right now, up a tiny 0.60% from yesterday. But when you zoom out to the daily chart, the bigger picture still looks rough.
Back in May, the XRP price was above $1.50. Now it’s down around $1.03. The recent candles keep making lower highs, and the price is hanging out near the bottom of its recent range. Buyers just haven’t done enough to turn things around.
The numbers back that up. The RSI is at 40.43, below the middle line, so sellers are still ahead. The Ultimate Oscillator is at 39.42, also below that neutral mark, same story, not much buying pressure.
The STOCH is at 28.76, which is getting close to oversold. That does leave some room for a short-term bounce, but the MACD is still negative at -0.0188, so the overall mood is still bearish.
The big line to watch is $1.06. If the XRP price can break above that, buyers might get a shot at pushing it toward $1.10–$1.15. But if it drops below $1.00, that would weaken things even more and open the door to lower levels.
| Indicator | Reading | Signal |
|---|---|---|
| RSI (14) | 40.43 | Bearish |
| STOCH (9,6) | 28.76 | Weak momentum |
| Ultimate Oscillator | 39.42 | Bearish |
| MACD | -0.0188 | Bearish |
Key Factors Pushing the XRP Price Presently
The delay of the U.S. Senate vote on the CLARITY Act has weakened hopes for near-term regulatory clarity. The floor vote has been pushed to September, keeping uncertainty around the treatment of assets such as XRP and limiting optimism around institutional demand.
Institutional buying has also slowed, with XRP ETF inflows reportedly falling more than 99% from May to August.
Still, the XRPL v3.3.0 upgrade adds a positive fundamental factor by introducing Confidential MPT, Batch, Permission Delegation, Sponsored Fees and Dynamic MPT, with privacy and flexible fees aimed at institutional use.
XRP Price Prediction for Today
Bullish Prediction:
If the XRP price breaks above $1.06, buyers could target $1.10, followed by $1.15 if momentum improves.
Neutral Prediction:
XRP could remain between $1.00 and $1.06 as traders wait for stronger buying pressure and regulatory developments.
Bearish Prediction:
A break below $1.00 could send the XRP price toward $0.98, with $0.95 becoming the next support.
Ethereum Price Gains 0.80% as Momentum Turns Positive
Ethereum is at $1,924.34, up 0.80% in the last day. We pulled up the chart, and it looks much healthier than XRP. Back in June, the ETH price was down around $1,550. But through July, it’s been making higher lows, and the recent candles have kept it above $1,900. That said, the $1,950–$2,000 zone is still a tough wall to break.
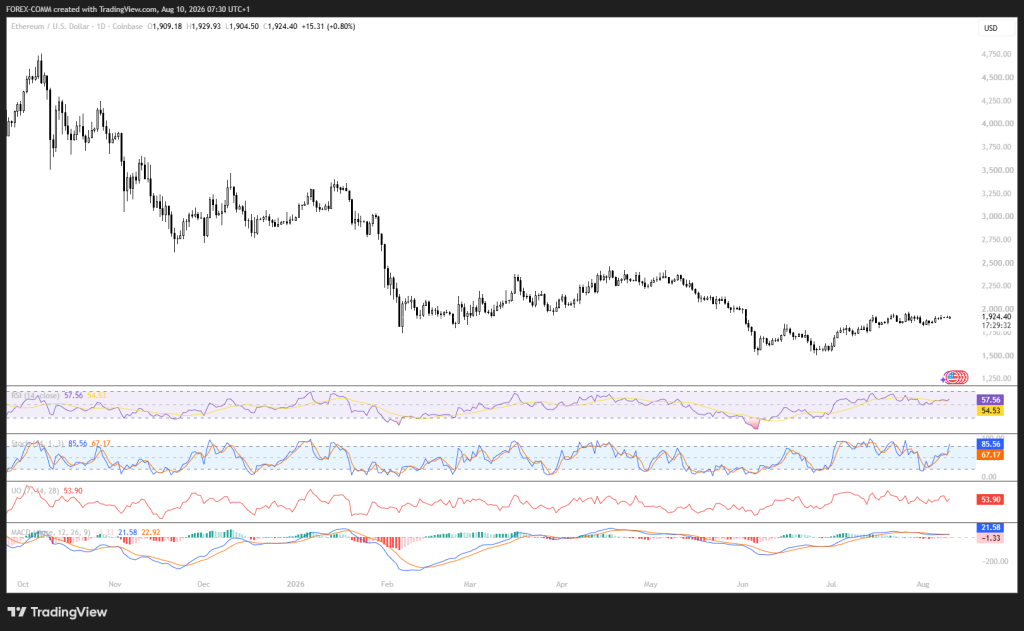
The numbers look decent too. The RSI is at 57.57, above the middle line, so buyers have the edge. The Ultimate Oscillator is at 53.91, also above that neutral mark. The MACD is positive at 21.54, which backs up the recovery.
The only caution sign is the STOCH at 85.75, that’s overbought, so we might see some people take profits in the short term.
All in all, the ETH price is in a better spot than XRP right now. But buyers still need to push past $1,950 to keep things moving. If they can break above $2,000, that would be a much stronger signal. On the other hand, if ETH drops back below $1,900, that would weaken the whole setup.
Related Ethereum News: Ethereum Price Prediction: These Charts Show Why ETH is Worth Watching
| Indicator | Reading | Signal |
|---|---|---|
| RSI (14) | 57.57 | Bullish |
| STOCH (9,6) | 85.75 | Overbought |
| Ultimate Oscillator | 53.91 | Bullish |
| MACD | 21.54 | Bullish |
Key Factors Pushing the Ethereum Price Presently
Ethereum is getting support from broader market strength, with its 0.80% gain coming alongside a 0.35% rise in total crypto market capitalization. Spot Ethereum ETFs have also accumulated about $11.46 billion in net inflows, giving ETH a structural source of demand.
Grayscale is also changing how its Ethereum staking product works, with staking rewards converted into monthly cash distributions and a reported net staking yield of about 2.61% annually after fees.
However, EIP-8363 could reduce native staking rewards as the amount of staked ETH increases, creating a longer-term concern for passive yield seekers.
Ethereum Price Prediction for Today
Bullish Prediction:
A break above $1,950 could push the Ethereum price toward $1,980, with $2,000 as the next psychological target.
Neutral Prediction:
ETH could trade between $1,900 and $1,950 as traders digest ETF flows and staking developments.
Bearish Prediction:
Losing $1,900 could send the ETH price toward $1,850, followed by $1,800 if selling pressure increases.
Bitcoin Price Holds $65K as ETF Inflows Support Buyers
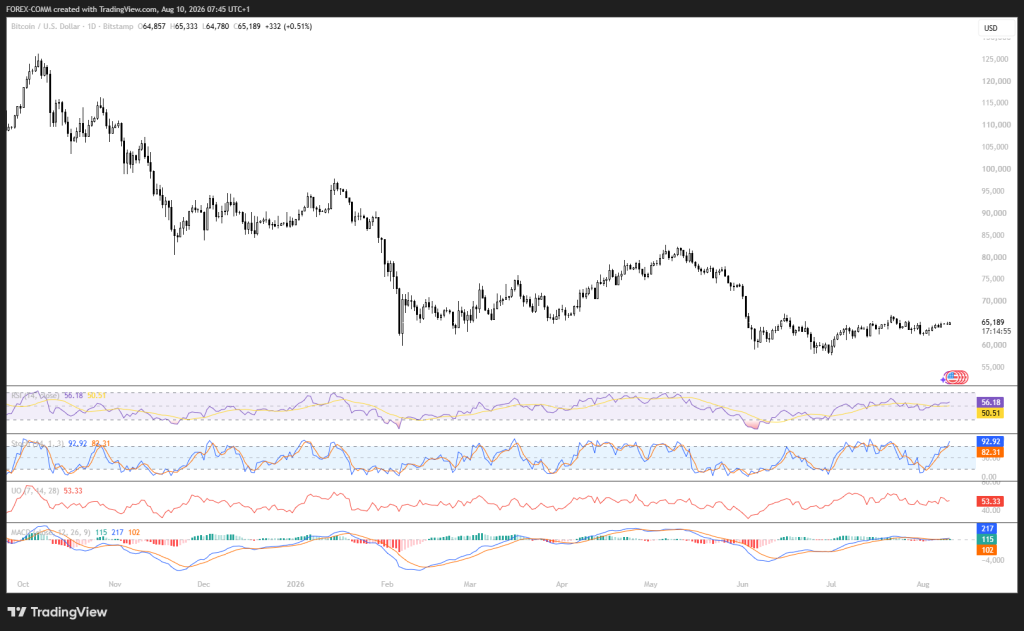
Bitcoin is at $65,117 right now, up 0.40% over the last day. We looked at the chart, and it looks like the price has been stuck in a range between $64,000 and $66,000 for a bit. This comes after it bounced back from that low near $58,000 back in June. The recent candles are bunched up tight, which tells you that buyers and sellers are still going back and forth at these levels.
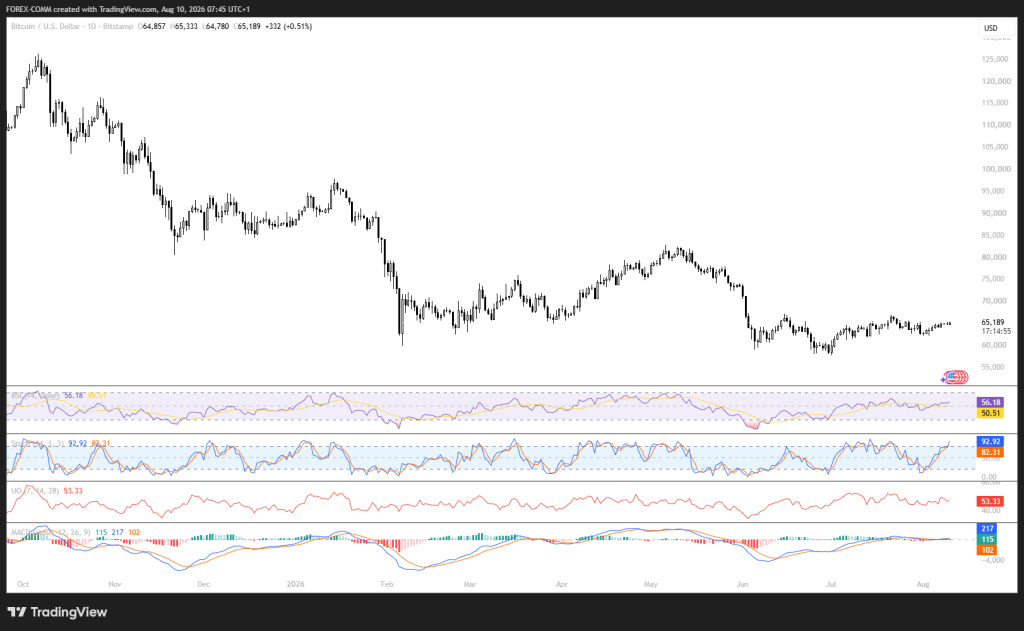
The indicators lean slightly in favor of the bulls. The RSI is at 55.78, above the halfway mark, and the Ultimate Oscillator is at 52.63, also showing positive vibes. The MACD is at 212, which is a strong positive number and keeps the bigger picture bullish.
But here is the catch: the STOCH is at 90.71. That is deep into overbought territory, so there is a real chance some people might take profits soon.
The big hurdle is still the $66,000–$67,000 zone. If the BTC price can break above that with conviction, it could run toward $68,000–$69,000. But if it loses $64,000, that would hurt the recovery and put $63,000–$62,500 back on the table.
| Indicator | Reading | Signal |
|---|---|---|
| RSI (14) | 55.78 | Bullish |
| STOCH (9,6) | 90.71 | Overbought |
| Ultimate Oscillator | 52.63 | Bullish |
| MACD | 212 | Strong bullish momentum |
Key Factors Pushing the Bitcoin Price Presently
U.S. spot Bitcoin ETFs recorded roughly $750 million-$850 million in net inflows over the past week, marking their strongest weekly result since mid-April. BlackRock’s IBIT and other large funds accounted for much of the demand, lifting Bitcoin ETF assets to about $79.84 billion.
Institutional use of Bitcoin is also expanding. MARA pledged 18,750 BTC worth about $1.2 billion as collateral for $600 million in financing, and Wintermute reported that institutions accounted for 72% of its spot OTC flow in the first half of 2026, up from 59% a year earlier.
Bitcoin Price Prediction for Today
Bullish Prediction:
If the Bitcoin price breaks above $66,000-$67,000, BTC could target $68,000, followed by $69,000 if buying pressure remains strong.
Neutral Prediction:
BTC could remain between $64,000 and $66,000 as traders wait for another catalyst and monitor ETF flows.
Bearish Prediction:
A break below $64,000 could push the Bitcoin price toward $63,000, with $62,500 as the next major support.
Frequently Asked Questions
Subscribe to our YouTube channel for daily crypto updates, market insights, and expert analysis.