
Shiba Inu is trading around $0.000004889 after a solid month of July. SHIB price pumped 33% in a matter of days and recovered nicely from the June low near $0.0000041.
The meme coin has been one of the better performers in the crypto market, outperforming many larger-cap altcoins. But the question on every trader’s mind is: how high can Shiba Inu price go by next month, September?
Let us have a look at the chart, the fundamentals, and the key levels to watch.
What you'll learn 👉
Shiba Inu News: Japan Green List and Shibarium Upgrade
Japan Adds SHIB to “Green List”
Japan’s Financial Services Agency, via the Japan Virtual and Crypto Assets Exchange Association (JVCEA), added Shiba Inu to its “Green List” . This pre-approved asset list, historically reserved for tokens like Bitcoin and Ethereum, allows domestic exchanges to list SHIB without lengthy, individual vetting.
The move significantly reduces regulatory friction for SHIB in Japan. It is part of broader reforms that could see lower tax rates for approved assets, making SHIB more attractive to Japanese retail and institutional investors.
Shibarium Upgrade Introduces Automatic Burns
The Shiba Inu team deployed a significant upgrade to its Shibarium layer‑2 blockchain, introducing automatic SHIB token burns. The update consolidates key DeFi functions – like swapping and staking – into a unified platform.
Marketing lead Lucie described it as solidifying the foundation for a more efficient ecosystem toolkit. The automatic burn mechanism could reduce supply over time, which is bullish for long‑term holders if demand remains steady.
The Shiba Inu community has a reason to feel optimistic again. Lucie, the ecosystem’s marketing lead, has returned to X after nearly two months of silence. Her absence had not gone unnoticed. Between early June and the end of July, she shared no updates and did not repost any ecosystem developments, prompting widespread speculation among supporters about the reason behind her disappearance.
Before stepping away, Lucie last posted on June 9, informing the community that ShibaSwap had resumed normal operations. She remained inactive for almost two months without providing any explanation. This week, she resumed activity by reposting several Shiba Inu-related updates originally published between July 30 and July 31.
日曜日に柴犬(SHIB)が36%急騰した後、韓国の取引所では8640億トークンが新たに移動。
— KURO🐾SHIBARMY JPN🇯🇵 (@kuro_9696_9696) July 30, 2026
次は第2ラウンドか?https://t.co/ynDIVaiOua
Although she has not yet issued a personal statement explaining her return, her renewed engagement has already getting big attention from the SHIB community.
SHIB Chart Analysis: Downtrend Intact, but Consolidation Underway
The 4‑hour chart shows SHIB/USD has been in a steady downtrend since February, sliding from roughly 0.0000065 down toward 0.0000041 at the June low.
The 200‑day moving average (light blue line) has been sloping down the entire period. Price is still trading well below it at 0.00000567 versus the current 0.00000489 – that is a long‑term bearish backdrop.
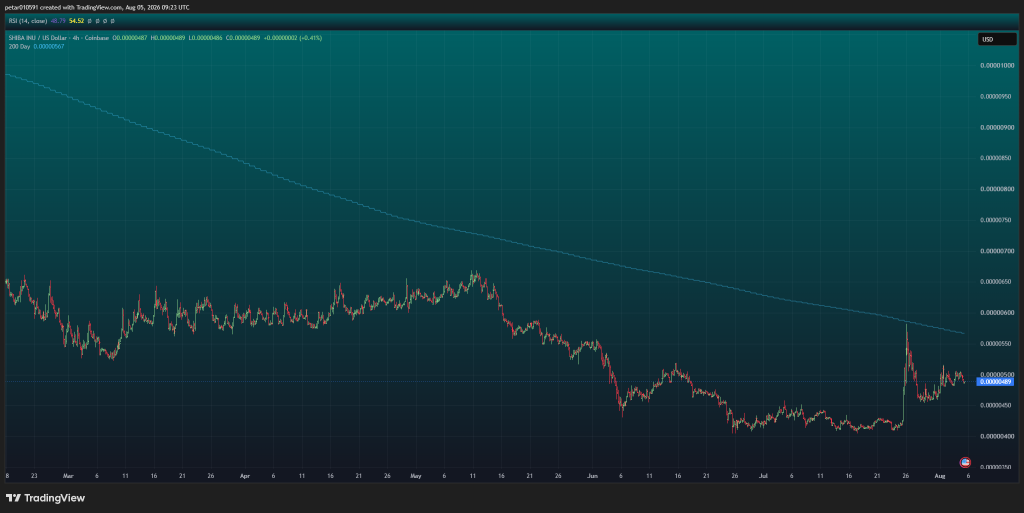
There is a big vertical pump around July 26. Price jumped from roughly $0.0000041 to $0.0000056 in one candle, which usually signals a news event or liquidation cascade rather than organic buying. Price has since given back most of that spike and is now consolidating in a tight $0.0000047–$0.0000051 range.
Short‑term RSI (14) sits near 50 (48.79/54.52). There is no strong momentum either direction on the 4‑hour chart right now – just chop.
Shiba Inu’s Technical Indicators
The monthly indicators tell a more bearish story.
ROC at -57.3 and ADX at 39 (with a directional “Sell” reading) both point to a strong, established downtrend on the higher timeframe. This is the most significant signal.
Williams %R (-93) and CCI (-87.8) are both showing oversold conditions. Oversold in a downtrend does not mean “buy” by itself. It means selling pressure has been intense and stretched, which sometimes precedes a relief bounce but can also just continue – oversold can stay oversold.
Ultimate Oscillator (32.4) leans bearish and weak, consistent with the rest. Bull/Bear Power reads neutral (0).
Overall picture: The monthly trend is clearly down (ROC, ADX), and multiple oscillators show it is stretched and oversold. This is a fairly classic “strong downtrend, but momentum indicators are flashing exhaustion” setup. The 4‑hour chart’s post‑spike consolidation could be read as the market digesting that move before choosing a direction.
SHIB Price Prediction for September 2026
The short‑term outlook for SHIB is mixed. The 4‑hour chart shows consolidation after a big pump, while the monthly indicators point to a strong downtrend with oversold conditions.
Bullish scenario: If SHIB breaks above $0.0000051 with volume, the next targets are $0.0000056 (the July 26 high) and then $0.0000060 (the 200‑day MA). A break above the 200‑day MA would be the first bullish signal in months. The Japan Green List and Shibarium upgrade provide fundamental catalysts that could support a rally.
Neutral scenario: SHIB continues to consolidate between $0.0000047 and $0.0000051. Low volume. No clear direction. This is the most likely outcome for the next few weeks.
Bearish scenario: If SHIB loses $0.0000047, the next support is $0.0000041 (the June low). A break below that would open the door to $0.0000035 .
My prediction for September: SHIB will likely trade between $0.0000045 and $0.0000060. The consolidation is likely to continue, with a potential test of the 200‑day MA near $0.0000056. A break above that level would be the first sign of a trend reversal, but the monthly trend remains bearish until proven otherwise.
Subscribe to our YouTube channel for daily crypto updates, market insights, and expert analysis.