
Ethereum price has been trading in the $1,800-$1,900 range for a few days. ETH has been range-bound after the big decline from the August peak above $4,900 in 2025.
While there are a few bullish takes about Ethereum price across the crypto community, one analyst, Northstar, tweeted a stark warning: “Ethereum – There has been ZERO reason to be bullish on this in 2026.”
What you'll learn 👉
The Etheruem Chart: A Multi-Year Ascending Channel Breaks Down
Northstar’s chart shows Ethereum’s price action within a well-defined rising channel spanning over four years. This is a genuinely long-lived structure, which gives it more technical significance than a shorter-term channel.
The channel’s origin is the 2022 bear market bottom around $1,030-$1,130 , where ETH based before beginning its recovery. From there, price carved out a series of higher highs and higher lows, repeatedly testing both the upper resistance and the rising support line underneath.
Through 2024 and 2025 , ETH tested the upper resistance line at least three distinct times. Each attempt topped out in a similar $3,700-$4,700 zone before rolling over. Meanwhile, the rising support line was tested and held on multiple occasions, confirming this as a genuine, respected technical boundary.
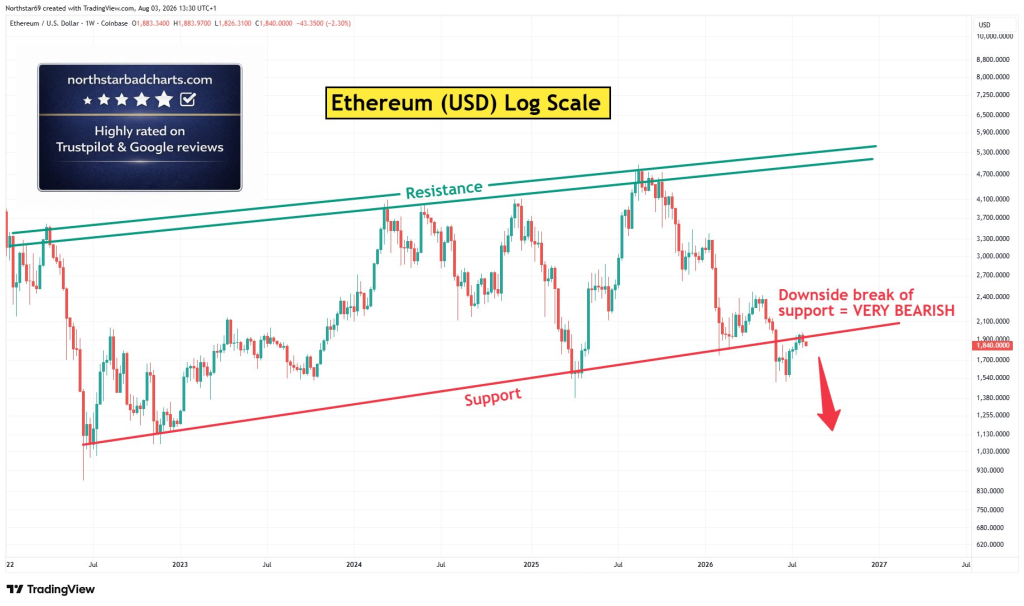
The most recent high (~$4,700, around July 2026) marked another rejection at resistance. Since then, price has declined sharply. Critically, it recently broke below the rising support line for the first time in the entire multi-year structure, dipping toward $1,700 before the current bounce to $1,840.
Why Is This Important Technically
This is the key argument behind the “very bearish” label. A trendline that has held for 4+ years and been tested repeatedly represents big technical memory. When it finally breaks, especially on a log‑scale chart, it often signals a genuine structural shift rather than noise.
The current price action shows ETH attempting to reclaim that broken support from underneath, which is now acting as resistance. This is a classic “retest” scenario. Whether it fails here or reclaims the line and closes back above it is the critical near‑term question.
What would confirm the bearish case: A clean rejection here around $1,840-$1,900 and a decisive move back below $1,700 . That would validate the “downside break = very bearish” thesis and open the door toward a much deeper move, potentially back toward the $1,130 origin of the channel or lower.
What would challenge the bearish case: A strong weekly close back above the old support line, roughly $1,900-$2,000 currently. That would indicate this was a temporary shakeout or false breakdown rather than a confirmed structural break.
Read also: We Asked ChatGPT to Predict Ethereum Price When Bitcoin Hits All-Time High
Ethereum News: Fee Disconnect and S&P Pantera Index
On‑chain analysis reveals a growing economic disconnect on Ethereum. Applications on Ethereum generated $1.8 billion in fees last quarter, but the base layer retained only $88 million , or 4.9%. This is because most user activity and fee generation has migrated to Layer 2 rollups, which now process vastly more operations per second.
The thesis is shifting. Analysts are arguing that Ethereum’s edge is now in secure, institutional settlement and tokenizing real‑world assets – not cheap transactions.
The newly launched S&P Pantera Digital Asset Index included Ethereum, Hyperliquid, and Solana, while excluding Bitcoin and XRP. The index’s criteria require networks to generate protocol revenue and pass a meaningful portion to holders, favoring tokens with strong financial fundamentals over pure speculative assets.
Where Could Ethereum Price Go From Here?
Northstar’s bearish thesis is built on a multi‑year technical breakdown. The broken support line is now resistance. The $1,840-$1,900 zone is the critical level to watch. Let me share with you my current Ethereum price predictions.
Short‑term (next few weeks): ETH is likely to test the $1,840-$1,900 resistance zone. If it fails to reclaim it, the next move is a decline toward $1,700 . A break below that opens the door to $1,500-$1,600.
Medium‑term (next 3-6 months): If the crash is confirmed, ETH could target the $1,130-$1,300 zone, the origin of the multi‑year channel. That would mean a further 40‑50% decline from current levels.
Bullish invalidation: A weekly close above $2,000 would challenge the bearish case. A move above $2,200 would indicate the breakdown was a false signal and that ETH could recover toward $2,500-$2,800.
My take: Northstar’s chart is one of the cleanest bearish setups I have seen on Ethereum. The multi‑year breakdown is technically significant. The fee retention issue is a real problem. The S&P Pantera index exclusion of Bitcoin and XRP is notable but does not change the technical picture. I want to see a weekly close above $2,000 before considering a position.
Subscribe to our YouTube channel for daily crypto updates, market insights, and expert analysis.