Silver price is trading around $57 after a few really slow price action days. The metal has been consolidating near the bottom of its descending channel, with traders watching for a breakout in either direction.
But analyst DeepValue Signals is urging caution. He is pushing back against the bullish “cup-and-handle” chart that has been circulating widely on social media.
What you'll learn 👉
The Tweet: “Don’t Blindly Anchor to the Cup-and-Handle”
DeepValue Signals posted a detailed warning about silver’s current setup:
“Is $500 silver still possible one day? Likely. But that is not the chart in front of us today.”
He noted that silver has now reached the first major support area around $54–$56 , exactly as discussed. But he warned against blindly anchoring to the famous monthly or weekly cup-and-handle chart being posted everywhere.
He explained that he actually posted that same structure on the three‑month chart and received plenty of flak for it. That version points toward a potential $37 backtest, not merely $54–$56. Those represent his first and third scenarios, with one additional support target sitting in between.
That is why he has consistently worked with three downside levels rather than pretending the first support must automatically mark the final low.
More importantly, silver has now broken the key $61.50 structure on the daily chart. Any account calling for immediate new highs without acknowledging that breakdown and the substantial overhead resistance should probably not be guiding your risk.
And here is the part he has not seen anyone mention: the current consolidation increasingly resembles a bearish continuation triangle , not a bullish continuation pattern. The four‑hour chart shows the compression clearly, but it is occurring after a decline and beneath broken support.
Could it still break upward? Of course. A triangle is not confirmed until price leaves it. But until silver reclaims $61.50 , the primary bias remains a lower‑low continuation rather than an immediate return to new highs.
Read also: ChatGPT Predicts Where Silver Price Could Go in August
Silver Chart Analysis: The Bearish Continuation Triangle
The big picture on the daily chart shows silver ran from roughly $42 in mid‑2025 to a spike high near $121 in early 2026 – an enormous, parabolic move. Since that top, price has been carving out a clear descending channel, making a series of lower highs and lower lows. It is currently trading at $57.58 , which is right near the bottom of that channel and just above the psychologically important $54–$56 zone.
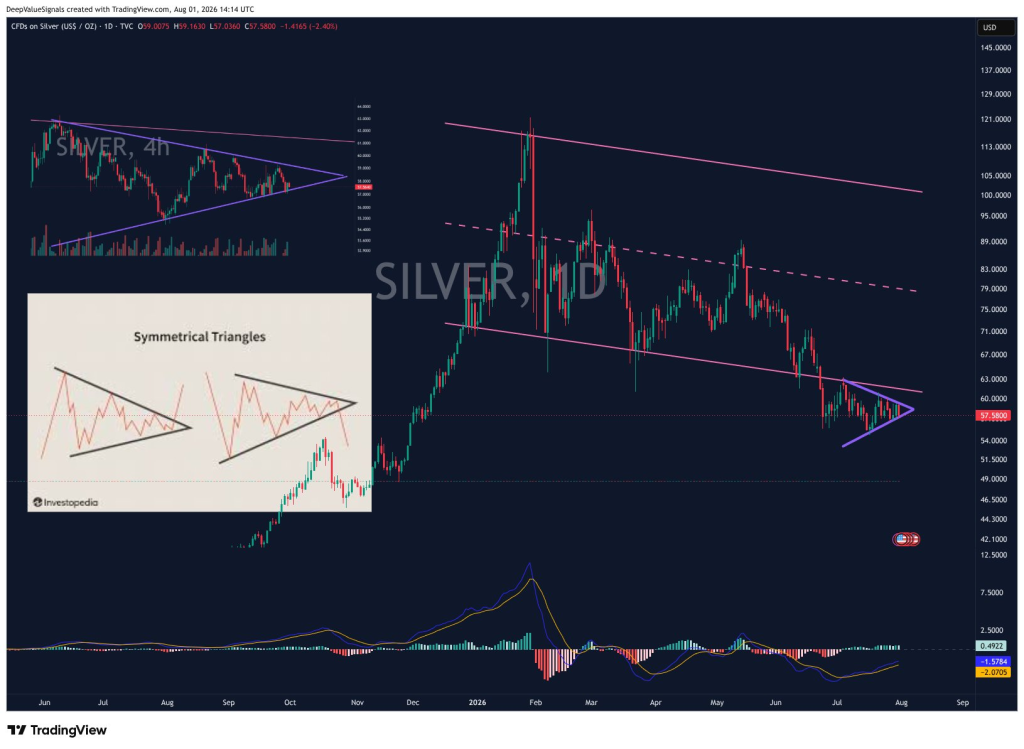
The key structural break: Price recently broke below the dashed pink trendline around roughly $61.50 – the level silver price needs to reclaim before any bullish case gets taken seriously again. That breakdown confirms sellers are still in control of the shorter‑term structure.
The consolidation pattern: Price has been compressing into a symmetrical triangle. The Investopedia reference image included in the chart is instructive: symmetrical triangles are genuinely neutral patterns until they break. They can resolve either bullish or bearish, and the deciding factor is usually the context they form in.
The actual disagreement here: The consensus “everyone’s posting” is a bullish cup‑and‑handle read on the higher timeframe. This analyst is making a more nuanced counter‑argument: because this triangle is forming after a decline and below broken resistance ($61.50), the higher‑probability read is a bearish continuation triangle , not an accumulation or reversal pattern.
Volume and momentum context: The Awesome Oscillator at the bottom shows a fading histogram with declining momentum on both the up and down swings recently. No strong directional signal yet, which supports the “wait for the break” framing rather than assuming either direction.
Why Is All This Important for Silver Going Forward
This is not a “silver is doomed” or “silver is about to explode” chart. It is a genuine coin‑flip setup structurally, but the context (broken support, post‑decline consolidation) tilts the technical bias bearish until $61.50 is reclaimed. The $54–$56 zone is the first real support test.
A break below opens the door to the $37 backtest scenario the analyst flagged as his more bearish alternate case.
DeepValue Signals is a high‑level analyst. His track record and the detail in his analysis make this worth paying attention to.
My Take: Staying Away Until Confirmation
I am staying away from silver for now. The silver chart does not look like we have bottomed yet. The descending channel is still intact. The $61.50 level has been broken. The consolidation pattern is forming after a decline, not during an accumulation phase.
Could the silver price break upward? Yes. But the probability tilts bearish until we see a reclaim of $61.50 and a confirmed breakout above the triangle.
For now, the $54–$56 zone is the first support to watch. A break below that would confirm the bearish continuation and open the door to the $37 target.
Subscribe to our YouTube channel for daily crypto updates, market insights, and expert analysis.