Dogecoin still looks bearish across the larger time frame, and the daily chart remains far from decisively bullish. However, several technical signals point to the possibility that DOGE price could be nearing an important move.
That possibility does not erase the wider downtrend. Dogecoin price still needs to clear several resistance levels before buyers can claim control. Javon Marks, Ali Charts, and Trader Tardigrade have now identified different chart patterns that support a possible bullish reversal.
Each analyst uses a different method. Javon Marks examines previous altcoin cycles, Ali Charts focuses on TD Sequential signals, and Trader Tardigrade studies price action alongside the Relative Strength Index.
What you'll learn 👉
Javon Marks Believes Dogecoin Price Could Repeat Its Previous Altcoin Cycles
Crypto analyst Javon Marks examined Dogecoin’s performance across its 2017 and 2021 cycles. His chart compares those periods with the developing 2026 cycle and applies Fibonacci extension levels to each one.
A look at the Dogecoin chart shows DOGE moving beyond the 1.618 Fibonacci extension during previous major altcoin cycles. Marks believes another dominant altcoin cycle could allow Dogecoin price to repeat that historical pattern.
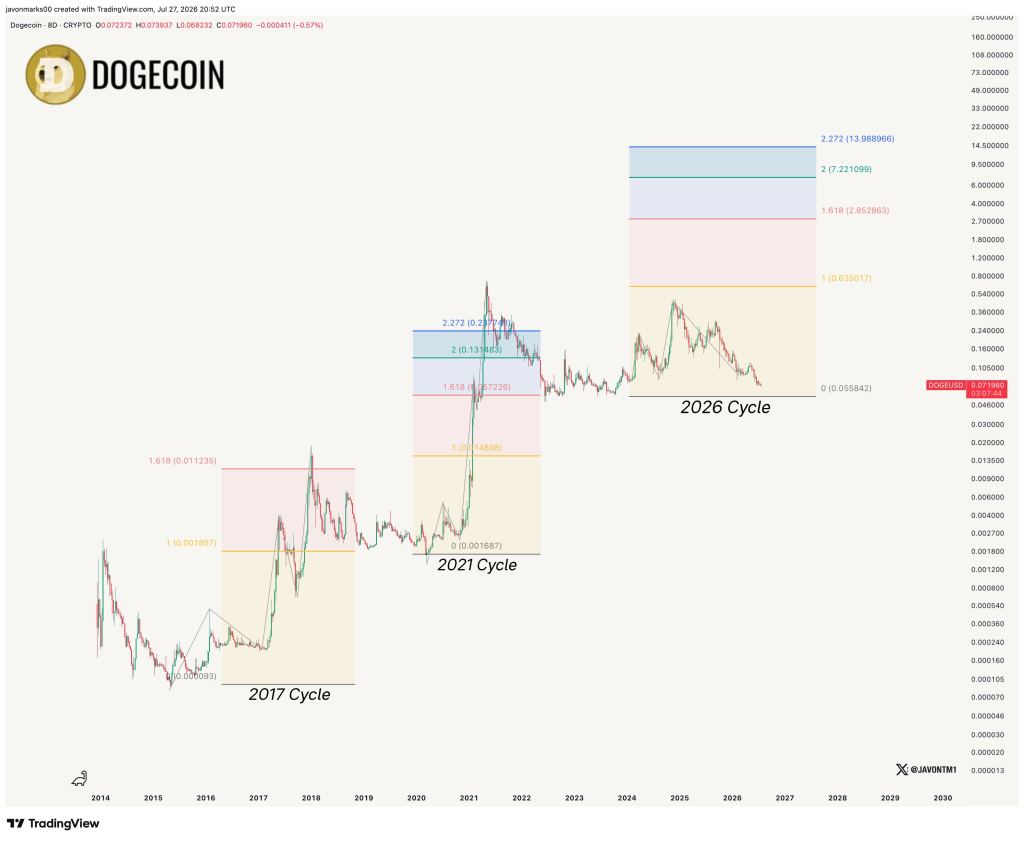
The chart presents 3 important details:
- Dogecoin crossed the 1.618 Fibonacci level during the 2017 cycle.
- DOGE moved beyond the same extension during the 2021 cycle.
- The 1.618 Fibonacci extension for the current cycle appears near $2.85.
Marks places his main target above $2.82. Dogecoin would need to climb more than 3,800% from its current region to reach that price. Such a move would be close to a 40X increase.
The prediction depends heavily on historical repetition. Previous results do not guarantee that Dogecoin price will follow the same route again. Market capitalization, available liquidity, investor demand, and the strength of the next altcoin cycle would determine whether such an advance becomes possible.
The chart also uses a logarithmic scale, which compresses large price changes across different cycles. That format makes long term comparisons easier, though it can make extreme targets appear closer than they are.
Dogecoin price reaching $2.82 would require far more than a small technical recovery. DOGE would need a powerful market cycle and enough capital to support a valuation far above its present level.
Ali Charts Finds Dogecoin Buy Signals Across Several Time Frames
Ali Charts identified another development that supports a possible Dogecoin price reversal. The analyst reported that the TD Sequential indicator produced buy signals across the monthly, weekly, 3 day, and daily charts.
The TD Sequential indicator examines a sequence of candles to identify periods when a trend may be close to exhaustion. A buy signal can appear after extended selling pressure and may indicate that bearish strength is weakening.
Dogecoin $DOGE is screaming BULLISH!
— Ali Charts (@alicharts) July 27, 2026
The TD Sequential has flashed buy signals on the monthly, weekly, 3-day, and daily charts.
It's rare to see this kind of alignment across so many timeframes at once. https://t.co/pJlR8oDYqt pic.twitter.com/8lf48e31Aq
Ali’s chart displays TD Sequential markers across all 4 time frames. This alignment matters because signals from longer time frames usually carry more weight than a signal from one daily candle.
The monthly and weekly signals point to possible exhaustion across the broader decline. The 3 day and daily readings focus on the more immediate Dogecoin price structure. Their appearance around the same period creates a stronger technical case than any single reading could provide.
However, the indicator does not confirm how far DOGE price could rise. TD Sequential buy signals can appear before a rebound, though price may still trade sideways or make another low.
Price confirmation remains necessary. Dogecoin must reclaim nearby resistance and hold those recovered levels before the wider chart can become convincingly bullish.
Trader Tardigrade Identifies 3 Bullish Signals on the Dogecoin Daily Chart
Trader Tardigrade examined the Dogecoin daily chart and identified 3 bullish signals in the same structure. His analysis focuses on bullish divergence, an RSI breakout, and a price breakout above a descending trendline.
The first signal comes from the disagreement between DOGE price and the Relative Strength Index. Dogecoin formed a lower low, though the RSI produced a higher low. This bullish divergence indicates that selling strength may have weakened even as price moved lower.
The second signal involves the RSI breaking above horizontal resistance. That move indicates improving momentum beneath the surface of the price chart.
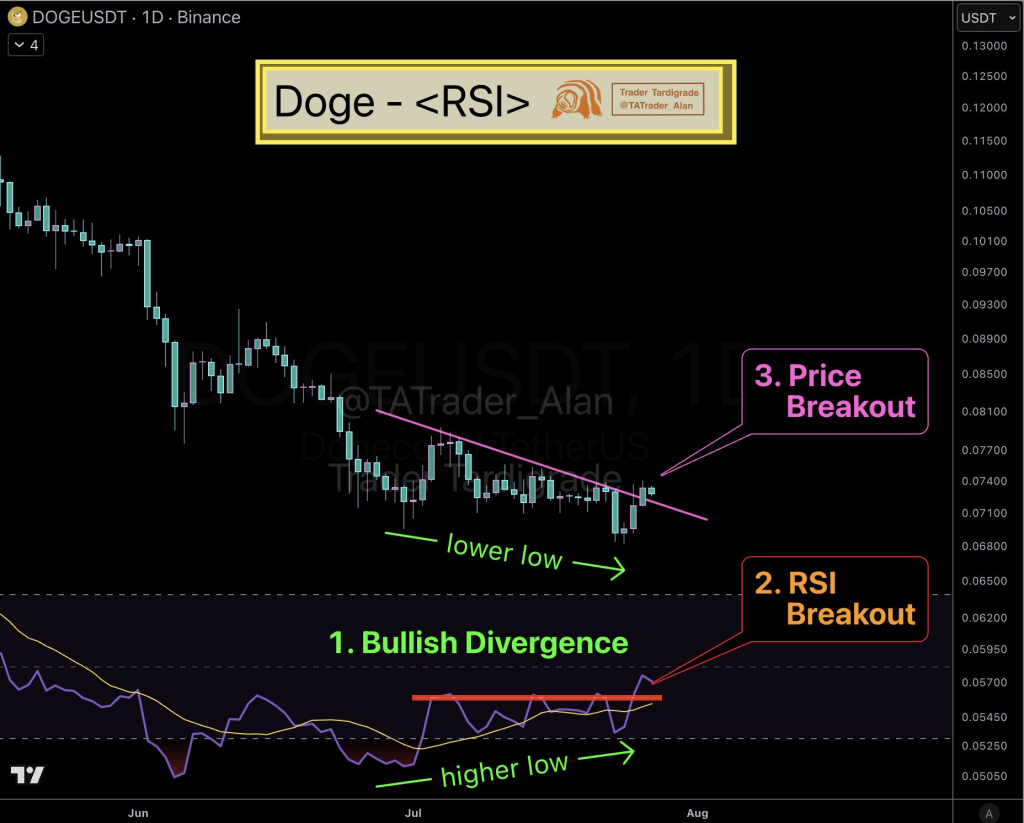
The third signal comes from DOGE price crossing above a descending trendline. That trendline had connected a series of lower highs and acted as resistance during the decline.
Trader Tardigrade considers the combination a confirmed reversal. However, Dogecoin must remain above the broken trendline and continue clearing price resistance before the broader market structure supports that conclusion.
False breakouts remain possible when trading volume is weak or the wider trend remains bearish. A move back below the trendline would reduce the strength of this setup.
Dogecoin Price Must Clear $0.075 Before Targeting Higher Resistance
Dogecoin currently trades near $0.070, which places DOGE close to its first major resistance on the daily chart. The immediate resistance appears near $0.075.
A confirmed break above $0.075 could open the way toward $0.078. Dogecoin price would then face another test because former resistance can reject price even after an early breakout.
Continued strength above $0.078 could place $0.089 within reach. This level represents the strongest resistance among the nearby targets and may require greater buying volume before DOGE can break through it.
Read Also: XRP Price May Never Reach $10 Unless These Six Catalysts Happen
The bullish route therefore follows a clear sequence:
- A break above $0.075 could send DOGE toward $0.078.
- A move beyond $0.078 could expose resistance near $0.089.
- A firm recovery above $0.089 would improve the wider daily structure.
Dogecoin still has immediate support near $0.068. Buyers recently defended this general region, which makes it important for the short term outlook.
A clear break below $0.068 could continue the decline and weaken the bullish signals identified by the 3 analysts. Such a move would indicate that sellers still control the daily Dogecoin price structure.
FAQs
Subscribe to our YouTube channel for daily crypto updates, market insights, and expert analysis.