
Ethereum is running the show today. The ETH price shot up 4.52% to $1,967.76 in the last 24 hours. The rest of the crypto market only managed 1.46%. So ETH is clearly outperforming.
What’s pushing it is the trading volume. It climbed 118% to $9.21 billion. That kind of jump usually means bigger players are stepping in.
Also, money is flowing out of Bitcoin and into altcoins. Ethereum’s market share went from 9.17% to 10.62% over the past month. The Altcoin Season Index is also climbing, which backs that up.
So the ETH price is getting a real push here. Buyers are trying to break through those resistance levels that have stopped every rally since early this year. If they can do it, things could get interesting.
What you'll learn 👉
Ethereum’s Price Action vs. Bitcoin
We pulled up both charts, Ethereum and Bitcoin, and one thing is obvious: ETH is moving way better than BTC right now.
The Bitcoin price is just stuck. It’s bouncing around between $64,000 and $67,000, and every time it tries to climb, it hits a wall near the top of that range.
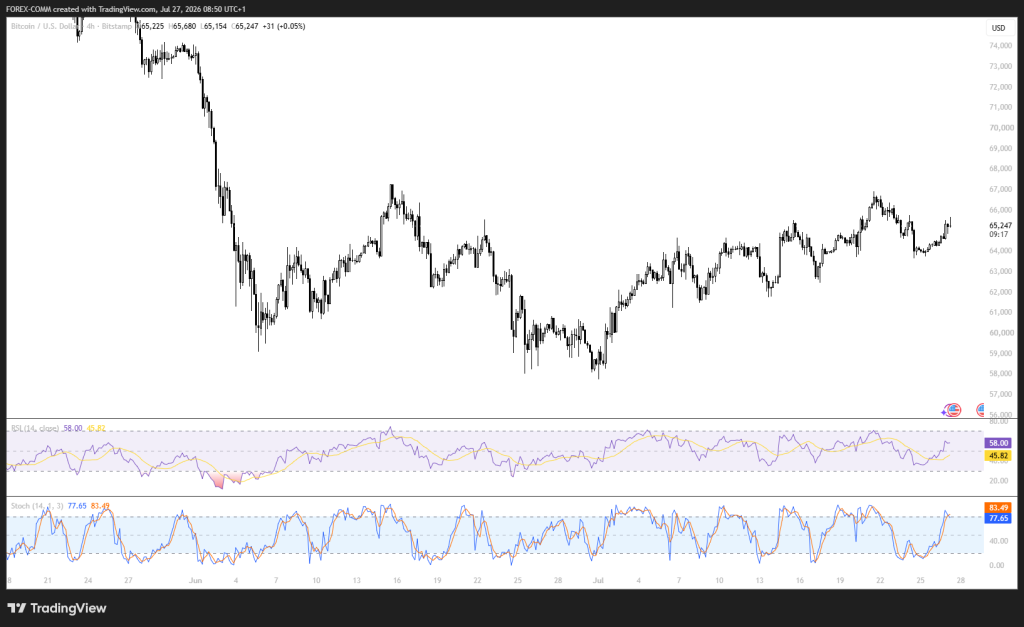
The RSI is at 58, which is fine, nothing broken. But Bitcoin still hasn’t managed to break above $66,000 with any real conviction. So it’s just stuck there, waiting for something to push it one way or the other.
The Ethereum price has delivered a stronger technical confirmation. After bouncing from support near $1,750, ETH has broken back above $1,900 and is testing the psychological $2,000 level.
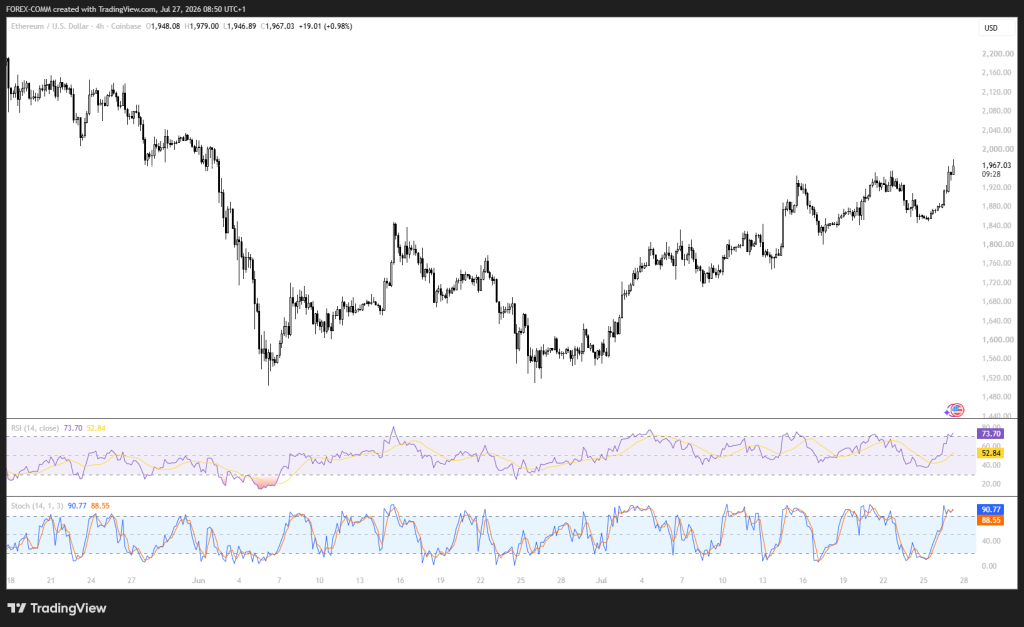
The 4-hour RSI has climbed to 73.7, showing strong buying pressure, and the recovery has produced higher lows and higher highs, unlike Bitcoin’s largely sideways structure. That relative strength points to fresh capital favouring Ethereum instead of simply following Bitcoin higher.
ETH ETF Inflows: The Numbers Behind the Move
Institutional demand is also leaning in Ethereum’s favour. Spot Ethereum ETFs recorded $104 million in net inflows between July 20 and July 24, extending their winning streak to three consecutive weeks.
Spot Bitcoin ETFs also finished the week positive, though total weekly inflows reached only about $3.4 million after heavy outflows of $225.1 million and $240.1 million erased most of the week’s earlier gains.
Spot Ethereum ETFs Record $104M in Weekly Net Inflows, Extending Streak to Three Weeks
— Wu Blockchain (@WuBlockchain) July 27, 2026
From July 20 to 24 (ET), spot Ethereum ETFs recorded $104 million in net inflows, marking a third consecutive week of inflows. Spot Bitcoin ETFs saw $3,379 in net inflows, also extending their… pic.twitter.com/PMpclJsimK
The contrast is important. Ethereum delivered cleaner and more consistent fund flows, even though Bitcoin ETFs remain much larger overall. Spot SOL ETFs added $7.2 million, XRP ETFs attracted $8.15 million, and HYPE ETFs recorded $8.61 million in outflows, showing institutional demand is becoming more selective instead of lifting every digital asset equally.
Related Ethereum News: Ethereum Price News: ETH Returns to Long-Term Wealth Zone as Arthur Hayes Buys and Whales Move Billions
What This Means Going Forward For Ethereum
The Ethereum price still has room to extend higher if fund flows remain consistent. The CLARITY Act if it passes will support sentiment around digital assets by giving institutions greater confidence in the regulatory outlook, and Ethereum remains one of the biggest beneficiaries because of its role in tokenisation, DeFi and stablecoins.
BeatQuant Weekly Market Structure Note
— BeatQuant (@BeatQuantAI) July 27, 2026
Last week looked constructive at first glance, but the structure was more fragile than the headline suggests.
BTC ETFs opened the week with three strong inflow days: +$226.8M, +$203.2M, and +$69.1M. Then the flow reversed sharply into…
Even so, liquidity still needs to improve. Stablecoin supply remains almost unchanged at roughly $309.8 billion, with a 7-day change of -0.04%, showing fresh capital has not fully entered the market. The next test is whether ETF inflows continue for another week, turning short-term demand into a more durable trend.
Ethereum Price Prediction: What’s Next?
We had a look at the higher time frame chart, and Ethereum has completed an important reaction from the monthly objective at $1,744 after falling from the previous three-month objective near $4,892 toward the larger downside target around $1,369. That monthly support has produced the strongest recovery ETH has delivered in months.
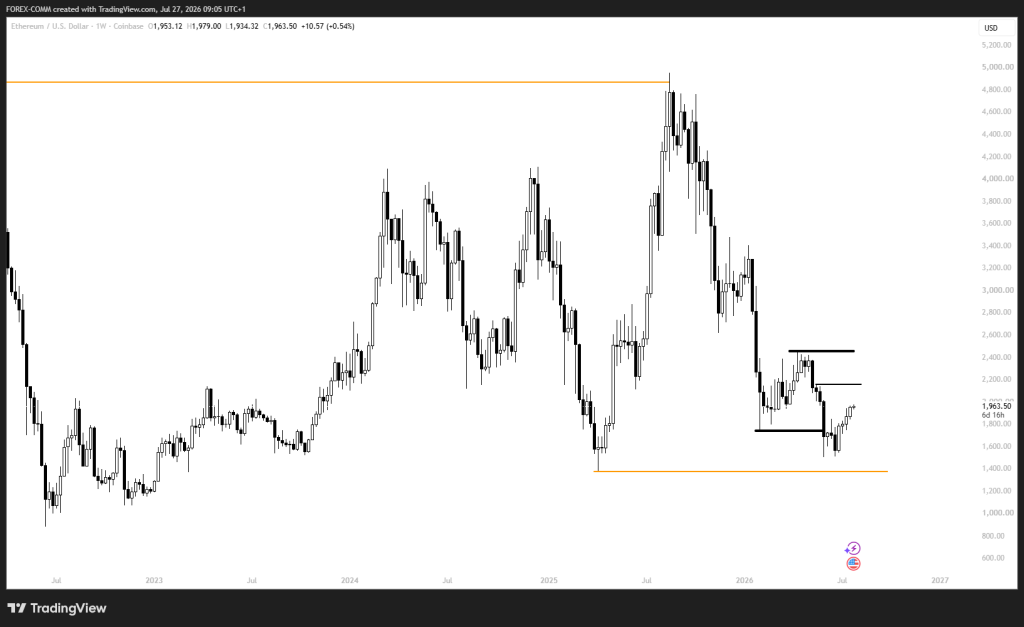
The next level to watch is $2,156. If the ETH price hits that $2,156 area and sellers push back, we could see it drop to $1,835 first, then $1,508. The bigger downside target is $1,369 if things really turn south.
On the other hand, if ETH breaks cleanly above $2,156, that changes things. That opens the door to $2,461, which is the next target on the monthly chart.
So buyers are in control for now. But that $2,156 level? That’s the one to watch. Whatever happens there probably decides the next big move.
Frequently Asked Questions
Subscribe to our YouTube channel for daily crypto updates, market insights, and expert analysis.