Silver price is at $58 at press time. The relief rally from this week did not really last. After briefly bouncing from the $55 level, silver has rolled over and is now struggling to hold above $58.
The broader precious metals complex remains under pressure. Gold is holding near $4,050. Silver is showing more volatility, as it typically does. The geopolitical backdrop is mixed, with Middle East tensions continuing to influence oil and safe-haven flows.
Analyst Rishabhh Jain has laid out a clear roadmap for the silver price. His view is bearish in the medium term, with a major downside target in the $36–$44 zone.
What you'll learn 👉
Bounce, Rejection, Fresh Decline
Rishabhh Jain tweeted his latest silver analysis:
“The roadmap remains unchanged. A relief rally toward the $76–79 resistance zone cannot be ruled out. However, unless Silver reclaims and sustains above this supply area, the move is likely to remain corrective.”
“My primary expectation is: Bounce → Rejection → Fresh decline. The next major downside objective lies in the $36–44 demand zone, where the larger corrective structure could complete.”
He highlighted the key levels:
- Resistance: $76 – $79
- Major Demand: $36 – $44
He also warned about market psychology: “Price doesn’t move in a straight line. It traps both bulls and bears before revealing its true direction. Patience and structure matter more than predictions.”
Silver Chart Analysis: The Spike-and-Collapse Structure
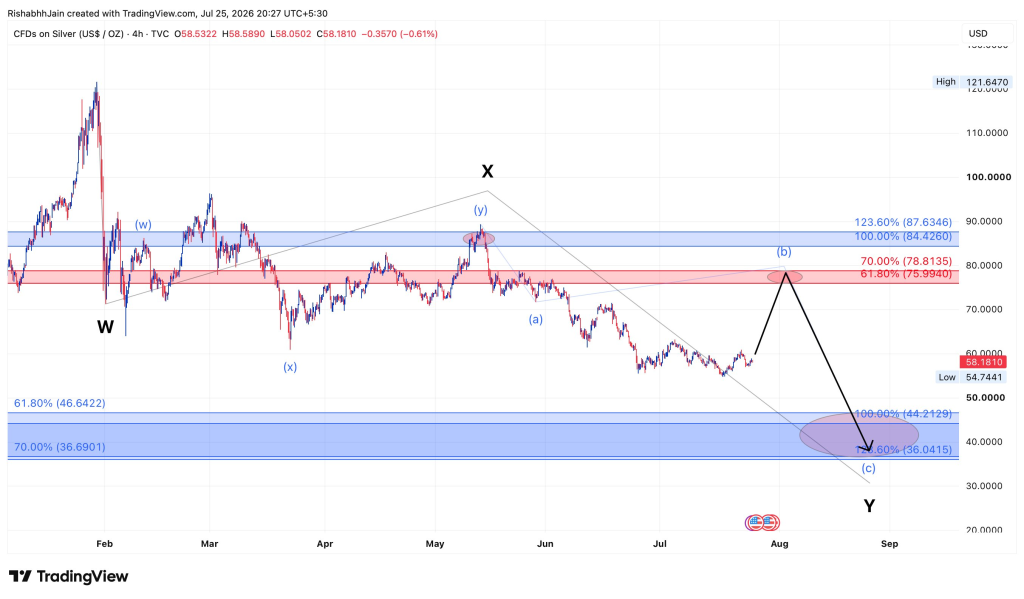
The chart shows silver’s price action from 2024 through 2026. The pimp to $121.67 on January 29, 2026, was real – silver’s nominal all-time high, driven by a geopolitical shock involving Middle East conflict, oil pumps, and safe-haven buying. It then collapsed hard and has spent the rest of 2026 unwinding that spike in a large, choppy correction.
The silver price action structure:
Wave W: From the January low near $58, silver exploded to $121.67, then crashed back to the mid-$70s. This whole pump-and-collapse is being treated as the first leg (W) of a larger three-part correction (W-X-Y).
Wave X: A corrective sideways structure unfolded from February through May. This formed a “flat top” with peaks near $87-88, bottoms near $73, and another peak near $85-88. The X apex near $97-98 on the grey trendlines is now acting as major resistance.
Wave Y in progress: A decline from the X high shows wave (a) dropping to roughly $68 in June, a small (b) bounce, and price grinding down through July to the current low near $55-58. Only wave (a) of Y looks complete on the chart. The analyst expects a (b) wave bounce followed by a (c) wave decline to complete wave Y.
Silver Price: Key Resistance and Support Zones
| Zone | Level | Role |
|---|---|---|
| Upper resistance | $84.43 – $87.63 (100%–123.6% fib) | X-wave highs, major overhead supply |
| Mid resistance | $75.99 – $78.81 (61.8%–70% fib) | Projected (b)-wave bounce target, former support-turned-resistance |
| Lower target zone | $36.04 – $44.21 (100%–123.6% extension) | Projected Y-wave downside objective |
Silver’s Bearish Roadmap
The black arrows on the chart represent the analyst’s projection, not price that has happened yet. The expected path is:
- A corrective (b) bounce from current levels up into the $76–79 supply zone
- Followed by a decisive (c) leg down to complete wave Y
- Targeting $36–44 , with $44.21 (100% extension) as the first objective and $36.04 (123.6%) as the extended one
This is a bearish medium-term count. The analyst is treating the entire 2026 move as an A-B-C style corrective sequence off the $121 pump, still unresolved, with one more sharp leg down expected after a relief rally.
Read also: Robert Kiyosaki Just Made a Massive Gold and Silver Price Prediction
Risks to the Bearish Count and What Could Invalidate It
Elliott Wave counts are inherently subjective. This is one valid interpretation, and the alternative – that the low is already in, or that this is a bottoming base rather than a mid-correction – cannot be ruled out.
A $36-44 target would mean silver giving back nearly all of its 2025-2026 rally. That is a large, low-probability move unless the underlying geopolitical and macro drivers reverse hard.
Current news flow is mixed and choppy. Silver rose 1.57% on July 24, 2026, though it is still down slightly over the past month. Near-term direction is being driven by Middle East-linked oil moves and Fed rate expectations, not pure technicals.
What could invalidate the bearish count:
- A sustained move above $79 would break the bearish structure and shift focus toward the upper resistance zone around $84–$87
- A break above $88 would completely invalidate the bearish wave count
- Changes in Fed policy, a weaker dollar, or renewed geopolitical safe-haven demand could override the technical picture
- If silver reclaims and holds above the $76–79 resistance area, the bearish count would be significantly weakened
For now, the bearish roadmap remains valid. But traders should watch the key levels closely. A break above $79 would change the entire picture.
Subscribe to our YouTube channel for daily crypto updates, market insights, and expert analysis.