Kaspa has spent most of 2026 under pressure, and many investors have started asking the same question. Has KAS finally reached its lowest point, or could another leg lower still be waiting?
A chart update from crypto analyst Crypto ₿ULL God has added a new perspective to that debate. His latest outlook points to a possible bottom, although the weekly chart still leaves room for several outcomes over the months ahead.
Crypto analyst Crypto ₿ULL God shared a new weekly Kaspa chart with a simple message:
“$KAS Weekly Truly looks like it has bottomed here and that blue zone is not coming If true, buckle up buttercup #Kaspa”
The key part of his outlook is the blue rectangle plotted below the current KAS price. Earlier, that area appeared to represent a possible final support zone where Kaspa could complete its correction.
His latest update shows he no longer expects price to reach that level.
Current weekly candles continue to hold above the green support zone around $0.028, which has strengthened his view that the market may have already printed its low. His use of the words “If true” also makes it clear that he is waiting for confirmation instead of declaring the bottom with certainty.
What you'll learn 👉
The Kaspa Chart Shows Sellers Losing Control
A closer look at the weekly chart explains why Crypto ₿ULL God has become more optimistic.
The first thing that stands out is the descending black trendline that has capped every rally since the middle of 2025. Kaspa remains below that trendline, so the larger downtrend has not officially ended.
Price action has changed in another important way, though. Recent weekly candles have stopped making aggressive new lows. Instead, KAS has spent several weeks moving sideways above the main support area near $0.028. That type of price behavior often shows selling pressure is beginning to fade after a prolonged decline.
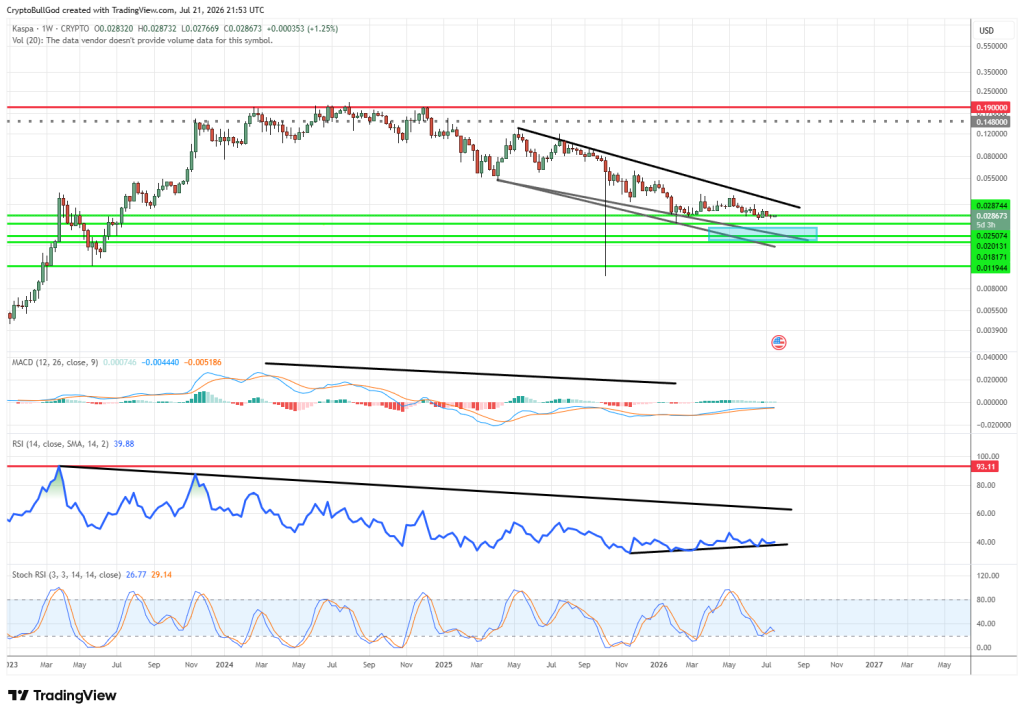
The analyst also removed the expectation that price would fall into the blue accumulation zone between roughly $0.020 and $0.025. His latest chart suggests buyers have stepped in earlier than expected.
Even so, Kaspa still needs to break above the descending resistance line before the weekly trend can fully turn bullish.
Momentum Indicators Show Early Signs Of Improvement
The momentum indicators underneath the chart also support the analyst’s cautious optimism.
The MACD has flattened after months of weakness. The histogram has started printing small positive bars, and the MACD line is attempting to cross back above the signal line. That usually points to fading bearish momentum, although stronger confirmation would require several more weeks of improvement.
The RSI tells a similar story. After trending lower throughout the correction, the RSI has begun to edge higher from the area around 40. That creates a small bullish slope even though price has remained relatively flat. This type of divergence can sometimes appear near important market bottoms.
The Stochastic RSI has cooled after its recent move higher and is now sitting around the middle of its range. That indicates momentum has slowed, although it has not returned to deeply oversold conditions.
Taken together, these indicators suggest downside momentum has weakened considerably. None of them confirms a new uptrend on their own, although they do support Crypto ₿ULL God’s view that Kaspa may already be building a base.
Kaspa Price Has Declined Steadily Throughout 2026
The broader picture remains more cautious despite the optimistic chart update.
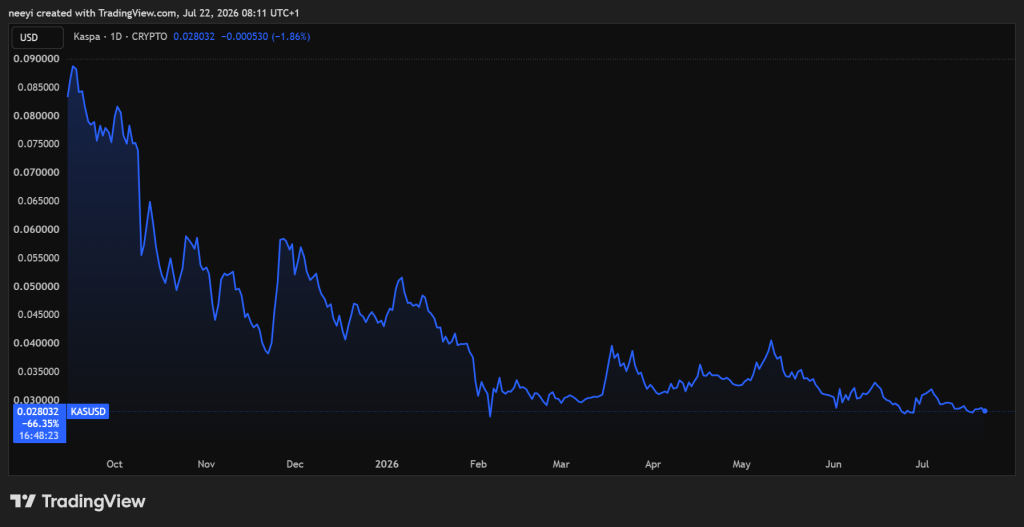
Kaspa has spent much of 2026 moving lower on gradually declining trading volume. That pattern looks more like a slow decline than a sharp collapse. Price started the year near $0.0429 with a market capitalization close to $1.16 billion. KAS now trades around $0.029, leaving it down about 32.66% since the beginning of the year.
Current market data also shows:
- Market cap around $778.36 million
- 24 hour trading volume near $11.18 million
- 24 hour performance around -1.04%
- 7 day performance near -2.47%
- 30 day performance close to -4.66%
Those figures show liquidity has gradually faded across the year. Lower trading volume often makes sustained recoveries more difficult unless fresh demand returns.
Weekly Kaspa Price Levels Continue To Define The Trend
The weekly KAS chart continues to show a clear pattern of lower highs.
Early January produced a high around $0.0429. Late March reached roughly $0.0386, and another lower high formed near $0.0365 during early May. That sequence creates a resistance area between $0.036 and $0.043.
Support has developed between $0.028 and $0.031 after several weekly closes gathered around that region during February, March, and June.
Volume tells a similar story. Weekly trading activity climbed above $25 million during some of the March rebounds. Recent weeks have remained closer to $8 million through $14 million, which shows buying interest has not fully recovered.
Read Also: Is Kaspa Better Than Solana for a 5-Year Investment?
Kaspa Mid Term Price Outlook Depends On Key Weekly Levels
The next 3 to 6 months could develop in several different ways. Much depends on how KAS behaves around its major support and resistance levels.
Base Case Shows Kaspa Moving Sideways With Mild Weakness
The most likely outcome for now is continued movement between $0.028 and $0.031 on the downside and $0.036 through $0.038 on the upside.
Weekly closes inside this range would point toward consolidation instead of a clear trend reversal. Price could continue moving back and forth across the band before choosing a stronger direction.
Bullish Scenario Requires Kaspa To Reclaim Major Resistance
The bullish outlook would improve if KAS closes above the $0.036 to $0.038 resistance area on the weekly chart.
Trading volume would ideally recover toward $20 million or more to support that move. Such a development could open the door for Kaspa to revisit its early 2026 high near $0.0429. Additional upside would depend on the broader crypto market and whether capital returns to higher risk altcoins.
Bearish Scenario Would Put Lower Prices Back Into Focus
Another outcome remains possible if support fails.
Several weekly closes below $0.028, combined with higher selling volume, would indicate buyers have lost control of the current support region. That could increase the probability of another move below the 2026 lows if weakness continues across the wider altcoin market.
FAQs
Subscribe to our YouTube channel for daily crypto updates, market insights, and expert analysis.