
Solana has spent months trying to recover from a painful slide that kept buyers on the defensive. Every rally eventually lost steam, and the SOL price repeatedly failed to reclaim key resistance levels. Fresh technical data now hints that the story could be changing, although the bigger picture still calls for caution.
One widely followed indicator has produced its first major buy signal since October. Short-term momentum has also started improving across several technical indicators. Those developments do not guarantee a rally, although they offer traders a fresh reason to watch whether Solana can finally challenge one of its biggest resistance levels.
What you'll learn 👉
Ali Martinez’s SuperTrend Signal Points to Higher SOL Price Targets
Crypto analyst Ali Martinez, better known as Ali Charts, believes Solana has entered an important technical phase.
His latest analysis shows that the ATR Trailing Stop has flipped below the SOL price. That change produced the first SuperTrend buy signal since October 10.
SOLANA TURNED BULLISH
— Ali Charts (@alicharts) July 15, 2026
The ATR trailing stop has flipped below price, marking the first SuperTrend buy signal since October 10.
If buying pressure continues to build, $SOL could rally toward $96 or even $121. However, $60 remains the key level to watch.
A break below that… https://t.co/Femtlawn2r pic.twitter.com/pJSFngWZiN
The SuperTrend indicator combines price action with the Average True Range, or ATR. Its purpose is to identify whether an asset is trending higher or lower. A buy signal appears when the indicator moves below the price. That usually means buyers have regained enough strength to challenge higher levels.
Ali believes continued buying pressure could open the door to two upside targets.
- First target stands around $96.
- Second target sits close to $121 if bullish momentum becomes much stronger.
His analysis also includes an important warning. Solana needs to hold above $60. A drop below that support would invalidate the current bullish setup and place sellers back in control.
Solana Price Still Faces a Major Weekly Resistance Barrier
The latest buy signal arrives after several difficult months for Solana.
A look at the weekly SOL chart shows that the broader trend remains bearish despite recent improvement. Solana has traded below the major weekly resistance around $98 since February. Every recovery attempt this year has failed near that area before sellers regained control.
Recent price action does offer one encouraging sign. SOL has recovered steadily during the past 5 weeks. Each weekly candle has pushed the price slightly higher, which shows buyers have gradually returned after months of weakness.
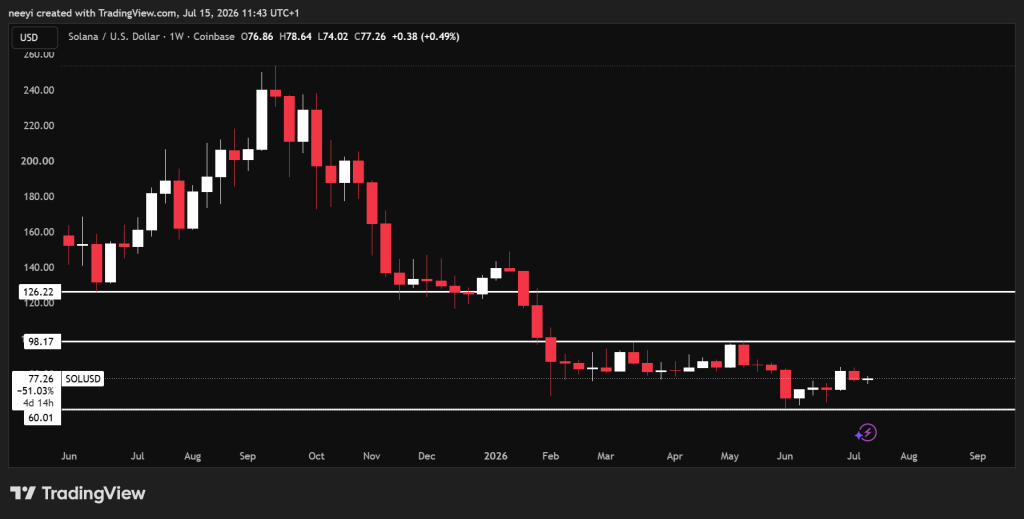
That steady recovery could become more important if it continues. Very little technical resistance appears before the $98 zone, which means the path toward that level looks relatively open if buyers remain active.
Everything changes once SOL reaches that resistance. The $98 level has rejected Solana several times this year. Another rejection could send the SOL price lower once again and extend the broader bearish structure.
A decisive weekly close above $98 would completely change the conversation. Such a breakout would show buyers have finally overcome one of the strongest barriers on the chart. Confidence could improve considerably if that happens, and many market participants would likely begin watching for the start of a larger bullish trend.
Short-Term Technical Indicators Show Buyers Slowly Returning
Weekly charts still require confirmation, although shorter timeframes already present a more constructive picture.
Several 5-hour technical indicators from Investing.com have moved into bullish territory. Each indicator measures a different aspect of market strength, so looking at them together provides a broader view of current conditions.
| Indicator | Value | What the Reading Means |
|---|---|---|
| RSI (14) | 52.033 | Momentum has moved slightly above the midpoint. Buyers currently hold a small advantage. |
| Stochastic (9,6) | 72.624 | Price strength has improved and upward momentum remains healthy. |
| ADX (14) | 31.781 | The current trend has enough strength to support continued movement. |
| Ultimate Oscillator | 55.055 | Buying pressure outweighs selling pressure across multiple timeframes. |
| Bull/Bear Power (13) | 1.444 | Buyers currently have more control than sellers. |
Each indicator tells a slightly different story.
The RSI has climbed above 50, which usually points to improving momentum without showing an overheated market. The Stochastic Oscillator also remains strong, which indicates buyers continue to push prices upward.
The ADX reading above 30 deserves attention because it measures trend strength instead of direction. That reading shows the current move has enough strength behind it to remain active.
Read Also: XRP and Solana Price Predictions as Cooling June CPI Data Boosts Risk Assets
The Ultimate Oscillator compares buying and selling pressure across several timeframes. Its current reading favors buyers. Bull/Bear Power also remains positive, which indicates bulls currently control the short-term battle.
Taken together, Investing.com data shows many 5-hour indicators have already turned bullish. That lines up with Ali Martinez’s recent SuperTrend signal and gives the short-term outlook a stronger technical foundation.
FAQs
Subscribe to our YouTube channel for daily crypto updates, market insights, and expert analysis.