Bitcoin price fell below $63,000 today, June 23. The drop was quick and violent.
Over $150 million in longs were liquidated from the crypto market in the past 15 minutes and over $530 million in the past 24 hours. Ethereum also got hit, falling below $1,700 for the first time since June 15. Altcoins are bleeding across the board. XRP, Solana, Cardano – all in the red.
Let us understand why the crypto market is down today.
What you'll learn 👉
Reason 1: Global Equity Markets Are Crashing
Bitcoin fell alongside a big drop in U.S. and Asian equity markets, particularly in AI and semiconductor stocks. The Nasdaq 100 futures dropped 1.3%, and South Korea’s Kospi plunged over 6% on June 23.
That triggered a flight from correlated risk assets like crypto. This shift highlights Bitcoin’s current sensitivity to traditional market sentiment over crypto-specific catalysts.
What it means: Bitcoin is trading more like a tech-risk asset than a decoupled store of value in the short term.
Watch for: U.S. jobs data on July 2 and CPI on July 14, which could influence Fed policy and broader risk appetite.
Reason 2: South Korea’s KOSPI Crashes 10%
South Korea’s KOSPI stock market crashed 10% today. That is a massive single-day decline that sent shockwaves through global risk markets.
JUST IN: 🇰🇷 South Korea's KOSPI stock market crashes 10% today. pic.twitter.com/dKW4qLkPec
— Watcher.Guru (@WatcherGuru) June 23, 2026
Crypto, being one of the most volatile risk assets, got caught in the crossfire. When Asian markets panic, crypto sells off. That is the pattern.
Reason 3: ETF Outflows Continue
U.S. spot Bitcoin ETFs had six consecutive weeks of net outflows, totaling $227 million last week. That signals continued institutional risk reduction.
Institutions are not buying the dip. They are selling into it. That removes a major source of demand that had supported Bitcoin in 2025.
Reason 4: Peter Schiff Takes a Shot at Saylor
Peter Schiff tweeted about JPMorgan’s infamous $6.2 billion “London Whale” loss. Then he connected it to MicroStrategy.
Schiff wrote:
“The London Whale cost JPMorgan 6.2B, one of the biggest losing trades ever recorded. MSTR is already sitting on a $10B paper loss on its Bitcoin trade. But by the time it’s closed out, @Saylor will shatter the record and book the biggest losing trade in history.”
The London Whale cost JPMorgan $6.2B, one of the biggest losing trades ever recorded. $MSTR is already sitting on a $10B paper loss on its Bitcoin trade. But by the time it's closed out, @Saylor will shatter the record and book the biggest losing trade in history.
— Peter Schiff (@PeterSchiff) June 22, 2026
Whether Schiff’s prediction comes true or not, the tweet adds to the bearish sentiment. Saylor’s paper loss is now a talking point among critics, which weighs on sentiment.
Bitcoin Chart Analysis: The 200-Day MA Is the Line
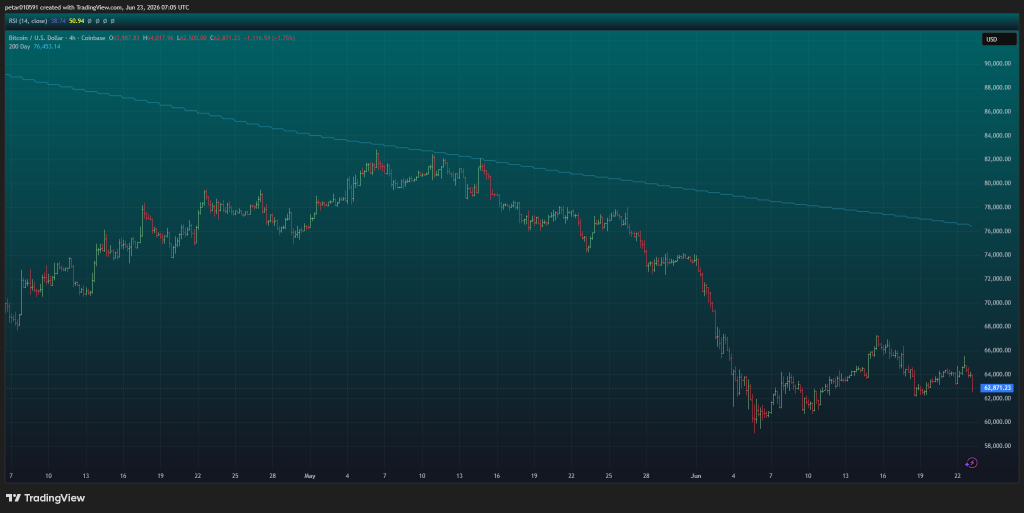
The attached TradingView chart shows Bitcoin/USD on the daily timeframe.
Key observations:
- Current Bitcoin price: $62,871 at the time of the chart. That is down heavily from the $70,000-$80,000 range earlier in the year.
- 200-day moving average: The blue line sits at $76,453. Bitcoin is trading $13,500 below its 200-day MA. That is one of the largest gaps in recent history.
- Price action: Bitcoin has been forming lower highs and lower lows since March. The trend is clearly down.
- Key support: $60,000 is the psychological level. Below that, $58,000 is the next support. The yearly low near $52,000-$55,000 is the final line.
The chart shows that Bitcoin is in a bear market by any definition. The 200-day MA is far above price. That has historically been a sign of extreme weakness.
Bitcoin Price Outlook
Short-term (next few days): Bitcoin is testing the $62,000-$63,000 zone. If that holds, a relief bounce toward $65,000 is possible. But the trend remains down.
Medium-term (next few weeks): The next major catalyst is U.S. jobs data on July 2 and CPI on July 14. If those prints come in hot, the Fed will stay hawkish, and Bitcoin could test $58,000 or lower.
Bearish scenario: A break below $60,000 opens the door to $58,000. Below that, $52,000-$55,000 is the next major support zone.
Bullish scenario: Bitcoin needs to reclaim $65,000 to show any short-term strength. A move above $70,000 would signal that the correction is over.
FAQs
Subscribe to our YouTube channel for daily crypto updates, market insights, and expert analysis.