The crypto market is down today almost 1% to $2.48 trillion because U.S. spot Bitcoin ETFs have seen nine straight days of net redemptions, totaling $2.84 billion. This persistent selling from regulated products signals reduced institutional appetite, which has cascaded into the broader market.
Bitcoin liquidations rose 296% in 24 hours to $26.82 million, amplifying the downward move as leveraged positions were unwound. Some coins are down with the market too. The XRP price is down almost 2%, and SOL is also down almost 2%.
However, Stellar seems to be feeling no volatility at all and is up 10%. What happens today will tell us a lot. Either these coins are getting ready to bounce back, or sellers are still running the show.
What you'll learn 👉
XRP Price Defends Support as Binance Inflows Hit a 2026 Low
Ripple’s XRP is trading at $1.3170 after falling almost 2% with the broader market. We looked at the chart and saw the price had been holding a rising channel’s lower support near $1.34.
That level just broke. The XRP price is now at $1.3170 after hitting a low of $1.3139. The high for this session was $1.3312, which shows buyers tried to push it back up but could not hold on.
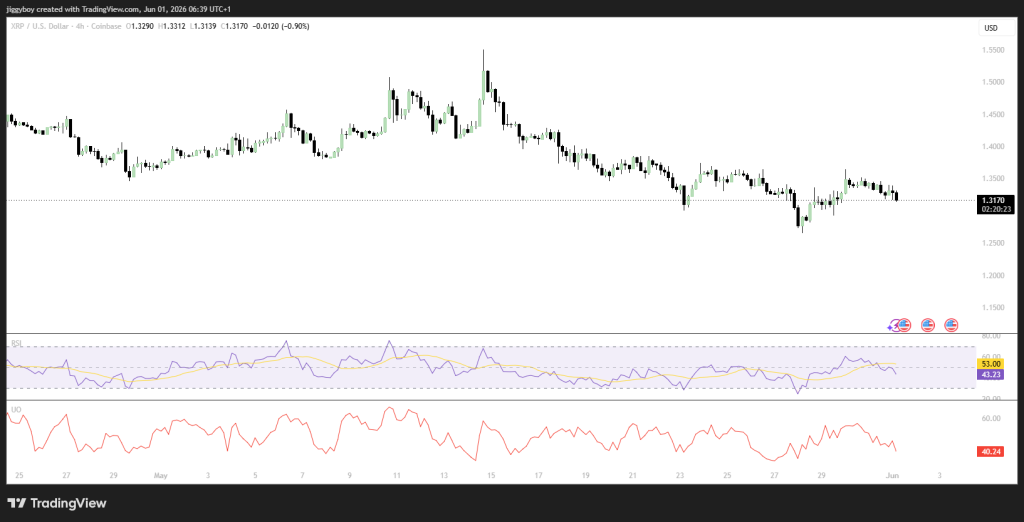
The RSI is 43.06. That is below the middle line, so sellers have a small edge right now. The Stochastic is 7.74. That is very low and puts the indicator in oversold territory. When you see numbers like that, a short-term bounce is often close.
The Ultimate Oscillator is 40.37. That is neutral to slightly bearish. The RSI Histogram is -2.8210. That tells us bearish momentum is there, but it is not extreme.
| Indicator Metric | Reading | Interpretation |
|---|---|---|
| RSI (14) | 43.06 | Sellers hold a small advantage |
| STOCH (9,6) | 7.74 | Oversold, recovery attempt may be due |
| RSI Histogram | -2.8210 | Bearish momentum is present |
| Ultimate Oscillator | 40.37 | Neutral-to-bearish |
Key Factors Pushing the XRP Price Presently
On-chain data shows XRP deposits to Binance dropped to 215 million tokens in May 2026. That is the lowest since early this year. This is a mildly good sign for the XRP price. When fewer tokens flow into exchanges, there is less immediate selling pressure. That can help keep the price stable near $1.34.
Panos Mekras, the CEO of Anodos Finance, said on May 31 that his firm has been buying XRP, holding it, and paying employees with it since 2023. They use it as a bridge to move money across networks like XRPL, Solana, and Flare.
This is a good sign for the XRP price because it shows real use by a real business, not just people betting on the price going up. It backs up the idea that XRP works as settlement tool between different blockchains.
XRP Price Prediction for Today
Bullish Prediction:
This is the less likely outcome for today. Ripple’s XRP needs to break above $1.34 first. A successful move above $1.34 could target the $1.37 region and reduce the bearish pressure.
Neutral Prediction:
A hold above $1.30 could keep the XRP price stable for most of the session. The XRP price may then consolidate between $1.30 and $1.34 as buyers and sellers battle for control.
Bearish Prediction:
A break below $1.30 is a clear bearish signal. XRP could then drop toward $1.26, and a failure to recover from that level opens the door to even lower prices near $1.22.
Stellar Price Rallies 10% as DTCC Taps the Network for Tokenized Securities
Stellar (XLM) is trading at $0.26338, up 10%. The rest of the market is flat or down. We looked at the chart. The high for this session was $0.26831, the low was $0.25980.
The DTCC, the company that clears over $114 trillion in trades every year, said it will connect its new tokenized securities platform to the Stellar blockchain. That connection is set for the first half of 2027. It will allow people to issue, settle, and manage tokenized assets like U.S. government bonds and major stock indexes right on Stellar.
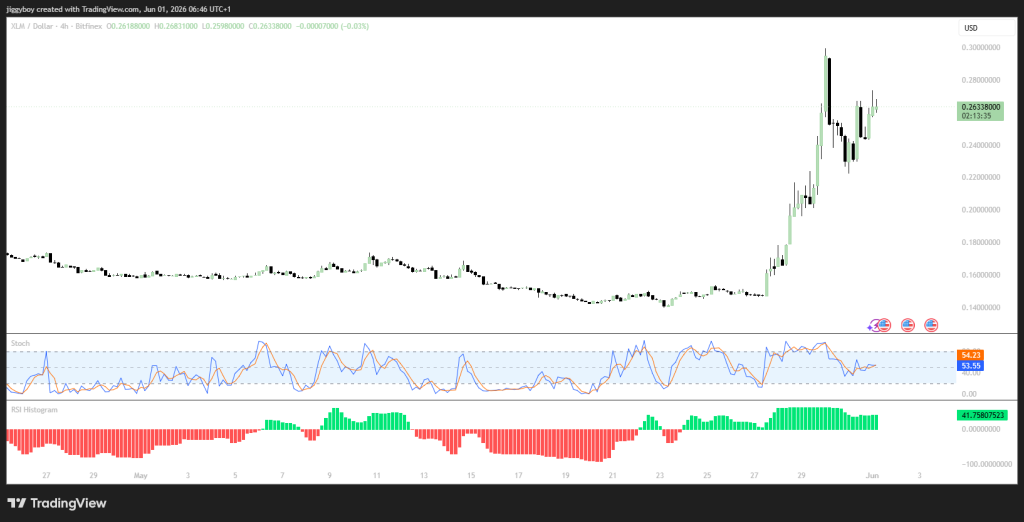
The RSI is 62.63. That is above the middle line and tells us buyers have a clear edge after this rally. The Stochastic is 53.55. That is a neutral number, but it leans toward buyers. It also means the market is not overheated.
The Ultimate Oscillator is 51.31, another reading that shows buyers are still in control. The RSI Histogram is 41.758, a strongly positive number that confirms bullish momentum is still there.
| Indicator Metric | Reading | Interpretation |
|---|---|---|
| RSI (14) | 62.63 | Buyers have a clear advantage |
| STOCH (9,6) | 53.55 | Neutral but favors buyers |
| RSI Histogram | 41.758 | Bullish momentum is intact |
| Ultimate Oscillator | 51.31 | Buyers still have control |
Key Factors Pushing the Stellar Price Presently
The DTCC integration is profoundly bullish for the Stellar price because it represents the highest-caliber institutional endorsement to date, directly linking Stellar’s infrastructure to the core of traditional finance. This validates the network’s compliance features and opens a pipeline for future real-world asset volume and utility-driven demand.
Stellar’s Soroban smart contract platform and the 2026 roadmap featuring Protocol 24 for zero-knowledge privacy aim to expand into DeFi and NFTs. Successful upgrades could increase on-chain activity, though the Stellar price must hold above key support at $0.2263 to maintain the new bullish structure after the 10% rally.
Related Stellar News: Swapping XRP for XLM – Ripple’s Ex‑Lawyer Explains the Real Mistake
Stellar Price Prediction for Today
Bullish Prediction:
First, Stellar needs to get past $0.2730. If it does that, the next target is $0.2900. And if it breaks above $0.2900, then $0.3000 comes into play.
Neutral Prediction:
The Stellar price could spend most of today moving between $0.2550 and $0.2730. That would mean XLM is just resting after its big jump up.
Bearish Prediction:
If XLM falls below $0.2500, that is a bad sign. The price could then drop to the $0.2263 support zone before buyers show up again.
Solana Price Tests Support as ETF Inflows Defy Broader Outflows
Solana is trading at $81.91, down almost 2% along with the rest of the market. We looked at the chart. The high for this session was $82.65, the low was $81.51.
Bitcoin ETFs have seen money leave for nine days in a row. But Solana spot ETFs brought in $15.6 million over the past week. Fidelity and Bitwise were the big buyers.
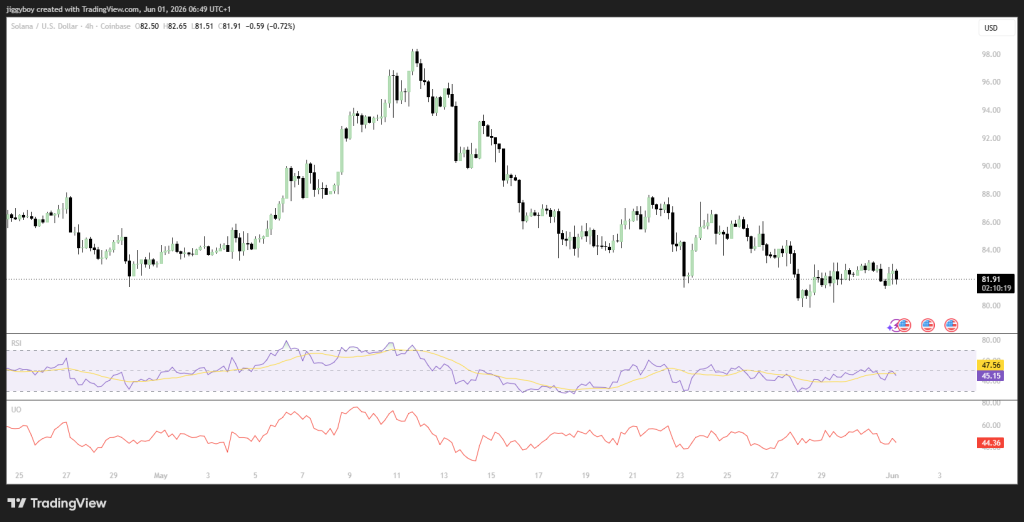
The RSI is 45.22. That is below the middle line, so sellers still have a small edge. The Stochastic is 30.73. That is close to oversold territory. So the drop may not go much further from here.
The Ultimate Oscillator is 44.36. That is neutral, leaning a little toward sellers. The RSI Histogram is -22.79. That is a negative number and tells us bearish momentum is still around.
| Indicator Metric | Reading | Interpretation |
|---|---|---|
| RSI (14) | 45.22 | Sellers hold a small advantage |
| STOCH (9,6) | 30.73 | Approaching oversold territory |
| RSI Histogram | -22.79 | Bearish momentum is present |
| Ultimate Oscillator | 44.36 | Neutral-to-bearish |
Key Factors Pushing the Solana Price Today
Solana is testing its ‘Alpenglow’ consensus upgrade, which proposes replacing Proof of History and TowerBFT with new ‘Votor’ and ‘Rotor’ components.
The goal is to cut transaction finality from 12.8 seconds down to 100 to 150 milliseconds. If done right, that would be great for Solana. It could lock in Solana’s usefulness for fast payments.
One analysis said Solana is unlikely to pass Ethereum’s market value by 2028. As of May 31, Ethereum’s lead was $196 billion. That is a tough reality check for the Solana price. It shows just how big the gap is.
Solana might close that gap with upgrades like Alpenglow. But to fully take the lead, a huge amount of money would have to move from one to the other. That is no small thing.
Solana Price Prediction for Today
Bullish Prediction:
This is the less likely outcome for today. The Solana price needs to break above $85.00 first. A successful move above $85.00 could target the $88.00 region and reduce the immediate bearish pressure.
Neutral Prediction:
A hold above $81.50 could keep the Solana price stable for most of the session. The Solana price may then consolidate between $81.50 and $85.00 as the market digests the ETF inflows.
Bearish Prediction:
If Solana falls below $81.50, that is a bad sign. The price could then drop to $78.00. And if it cannot bounce back from there, lower prices near $75.00 could come next.
Frequently Asked Questions
Subscribe to our YouTube channel for daily crypto updates, market insights, and expert analysis.