
Bitcoin, XRP, and FET are all approaching important levels after several days of mixed price action across the crypto market. Bitcoin has spent the past few days under pressure and is now testing a trendline that has supported the market since February. XRP is attempting to recover after a prolonged decline, and FET continues to battle a resistance zone that has repeatedly stopped buyers.
Today’s price action could provide important clues about whether these assets are preparing for a recovery or whether sellers remain in control.
What you'll learn 👉
Bitcoin Price Tests a Major Trendline Support After Three Consecutive Red Days
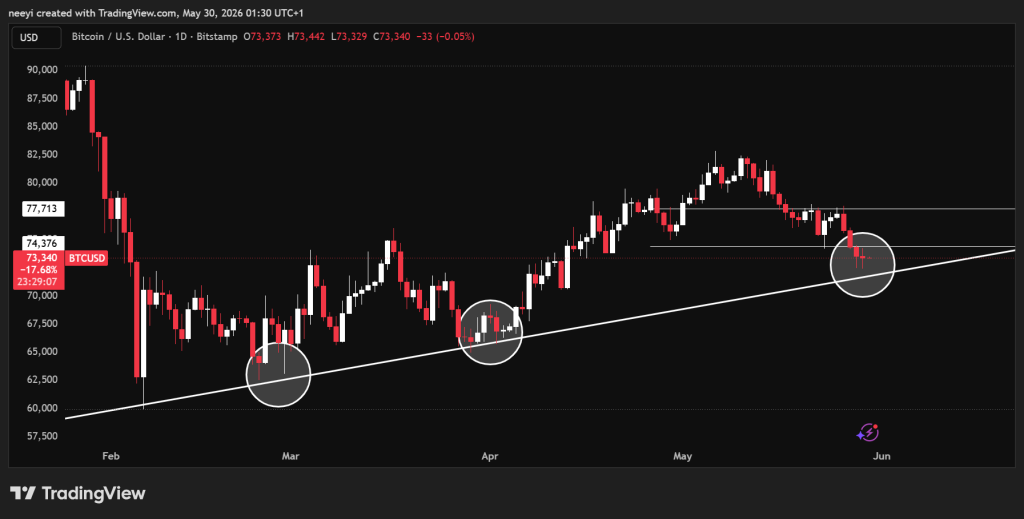
BTC price has continued to decline over the past few days. Bitcoin has now printed three consecutive red daily candles after falling from around $78,000 to a low near $72,500 yesterday.
A broader look at the Bitcoin chart reveals that BTC has respected an ascending trendline since February. Price bounced from this trendline multiple times during late February and again during March. Bitcoin is now testing that same trendline once more.
This area could prove important because a successful bounce would allow BTC to continue forming higher highs and higher lows. The key levels for today remain the ascending trendline, $74,400, and $77,700.
The Relative Strength Index currently reads 38.142. This reading remains below the neutral 50 level and shows that sellers still maintain an advantage. The indicator has not yet reached deeply oversold conditions, which means additional downside pressure cannot be ruled out if support levels fail.
The Stochastic indicator currently stands at 97.419. This is an extremely high reading and places the indicator in overbought territory. Such readings often appear when a short term recovery attempt takes place. The reading suggests Bitcoin may struggle if buyers fail to push through nearby resistance levels.
The MACD reading stands at -797.7. This remains a bearish signal because the indicator continues to trade below its neutral level. The negative reading shows that downward momentum remains dominant despite attempts to stabilize.
The Ultimate Oscillator currently reads 54.833. This is one of the more encouraging signals for Bitcoin today. A reading above 50 suggests that buying pressure still exists and that buyers continue to defend important support zones.
| Indicator Metric | Reading | Interpretation |
|---|---|---|
| RSI (14) | 38.142 | Sellers still have an advantage and downside pressure remains present |
| STOCH (9,6) | 97.419 | Overbought reading may limit immediate upside |
| MACD (12,26) | -797.7 | Bearish momentum remains dominant |
| Ultimate Oscillator | 54.833 | Buyers are still defending key support levels |
Bitcoin (BTC) Price Prediction for Today
Bullish Prediction
This remains the least likely outcome today. Bitcoin would first need to reclaim $74,400 and then break above $77,700. A successful move through both levels could open the door for stronger upside action before the daily close.
Neutral Prediction
A move above $74,400 could reduce immediate bearish pressure. This scenario could keep BTC trading between $74,400 and $77,700 for most of the day as buyers and sellers continue battling for control.
Bearish Prediction
The broader outlook remains bearish while Bitcoin trades below $74,400. Continued weakness could keep BTC below that level for the rest of today’s session. The ascending trendline may still act as temporary support and help support a recovery attempt over the medium term.
XRP Price Attempts a Recovery After Defending Support Near $1.26
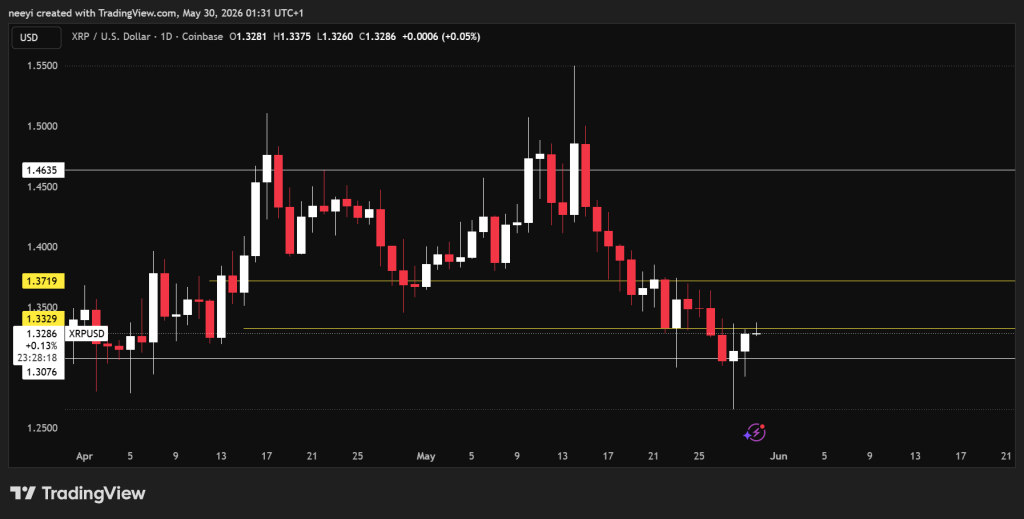
XRP is beginning to show signs of recovery after spending several weeks under pressure. The XRP price currently trades around $1.32 and is testing resistance near $1.33.
Thursday’s decline pushed XRP down to approximately $1.26 before buyers stepped in. Price has since recovered and is now attempting to turn former support zones into new launching points for a larger rebound.
A break above $1.33 would place the next major target near $1.37.
The Relative Strength Index currently reads 49.911. This places the indicator almost exactly at the neutral level. Neither buyers nor sellers currently hold a decisive advantage based on this reading.
The Stochastic indicator stands at 68.791. This reading favors buyers and shows that upward momentum has started improving following the recent bounce from $1.26.
The MACD currently reads -0.007. Although the reading remains negative, it is very close to neutral. This suggests bearish momentum has weakened substantially and that a trend reversal remains possible if resistance levels break.
The Ultimate Oscillator reads 50.571. This neutral reading shows that buying and selling pressure remain relatively balanced at current levels.
| Indicator Metric | Reading | Interpretation |
|---|---|---|
| RSI (14) | 49.911 | Market remains balanced between buyers and sellers |
| STOCH (9,6) | 68.791 | Buying pressure is gradually improving |
| MACD (12,26) | -0.007 | Bearish trend is weakening |
| Ultimate Oscillator | 50.571 | Market remains neutral overall |
XRP Price Prediction for Today
Bullish Prediction
This remains the less likely outcome for today. XRP would need to break above $1.33 and then clear $1.37. A successful breakout above $1.37 could allow XRP price to move toward the $1.40 region.
Neutral Prediction
A move above $1.33 could reduce the current bearish outlook. Price may then consolidate between $1.33 and $1.37 as the market searches for its next direction.
Bearish Prediction
The XRP price remains vulnerable while trading below $1.33. Continued rejection from that resistance level could leave sellers in control and expose XRP to another period of weakness.
FET Continues Struggling Against Resistance at $0.26
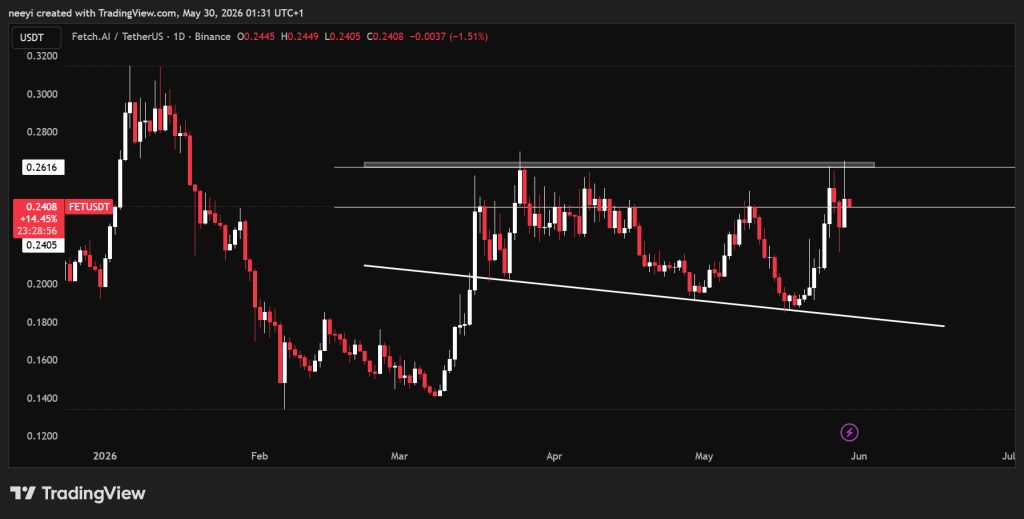
Artificial Superintelligence Alliance’s FET token has spent the past three days testing resistance near $0.26. That level continues to hold and has prevented buyers from extending the recovery.
The current setup remains straightforward. A break above $0.26 would strengthen the bullish case considerably. A drop below $0.24 would hand control back to sellers. Price could also remain trapped between those two levels if neither side gains a clear advantage.
The Relative Strength Index currently reads 57.439. This reading remains above the neutral 50 level and indicates that buyers currently have a slight advantage.
The Stochastic indicator stands at 56.511. This reading also supports buyers and suggests that upward momentum remains intact despite repeated resistance at $0.26.
The MACD currently reads 0.007. This positive reading supports the bullish case and shows that momentum has gradually improved over recent sessions.
The Ultimate Oscillator reads 49.228. This reading remains close to neutral and suggests that buyers still need stronger participation before a decisive breakout becomes possible.
| Indicator Metric | Reading | Interpretation |
|---|---|---|
| RSI (14) | 57.439 | Buyers currently hold a slight advantage |
| STOCH (9,6) | 56.511 | Positive momentum remains intact |
| MACD (12,26) | 0.007 | Trend remains mildly bullish |
| Ultimate Oscillator | 49.228 | Market remains close to neutral conditions |
FET Price Prediction for Today
Bullish Prediction
The $0.26 resistance level has remained intact since March and continues to act as a major obstacle. A breakout above that zone would represent a major bullish development. Such a move could send FET toward levels not seen since January.
Neutral Prediction
Price could remain trapped between $0.24 and $0.26 if buyers and sellers continue cancelling each other out. This outcome would keep FET in consolidation mode throughout today’s session.
Bearish Prediction
A break below $0.24 followed by a failed recovery could completely change the short term outlook. Such a move could send FET toward lower levels near $0.22 before stronger support appears.
FAQs
Subscribe to our YouTube channel for daily crypto updates, market insights, and expert analysis.