
Crypto markets opened May 23 under pressure after another wave of selling pushed several major assets closer to key support zones. XRP price continued sliding toward a major support region near $1.32. Bitcoin price struggled to defend the $75,000 area after recent weakness returned across the broader market. Zcash also cooled down after its recent rally. The ZEC price now risks deeper downside if buyers fail to reclaim important resistance levels.
That market reaction reveals buyers are still defending several major support zones, but momentum indicators now show weakness across multiple timeframes.
What you'll learn 👉
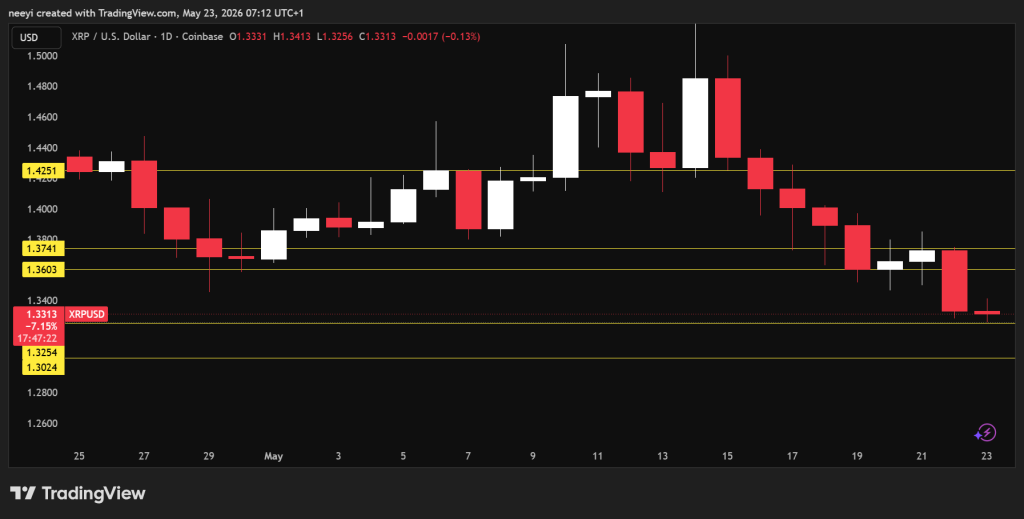
XRP Price Continues Testing Major Support Near $1.32
XRP price has now reached one of its most important short term support zones near $1.32. Recent weakness pushed the asset lower after repeated failures near higher resistance regions. Price action now shows the market struggling to reclaim the $1.36 to $1.37 range.
A look at the XRP chart shows sellers still controlling short-term momentum. Another move lower could send XRP price toward the $1.30 area if the current support fails to hold. Recovery still remains possible, although buyers need stronger momentum above the nearby resistance levels first.
The indicator readings also paint a cautious picture for XRP price today.
The Relative Strength Index currently reads 37.793. That level shows weakening momentum and continued selling pressure across the market.
The Stochastic indicator stands at 43.316. Current readings still point toward weakness after recent downside continuation.
MACD readings remain negative at -0.013. That setup usually points toward bearish market control in the short term.
The Ultimate Oscillator currently sits at 43.124. That reading still supports the broader bearish outlook for XRP price.
| Name of Indicator | Metrics | Interpretation of Readings |
|---|---|---|
| RSI(14) | 37.793 | Sell signal shows weakening momentum |
| STOCH(9,6) | 43.316 | Sell signal points toward continued weakness |
| MACD(12,26) | -0.013 | Negative momentum still favors sellers |
| Ultimate Oscillator | 43.124 | Sell pressure remains dominant |
XRP Price Prediction for Today
The bullish scenario for XRP price depends heavily on the $1.37 resistance level. A successful break above that zone could push XRP toward the $1.42 level later today.
The neutral scenario remains a continued consolidation between $1.32 and $1.36. Current price action makes this one of the more realistic outcomes for now.
The bearish scenario becomes active if XRP price breaks below the $1.32 support zone. That move could expose the market to another dip toward the $1.30 region.
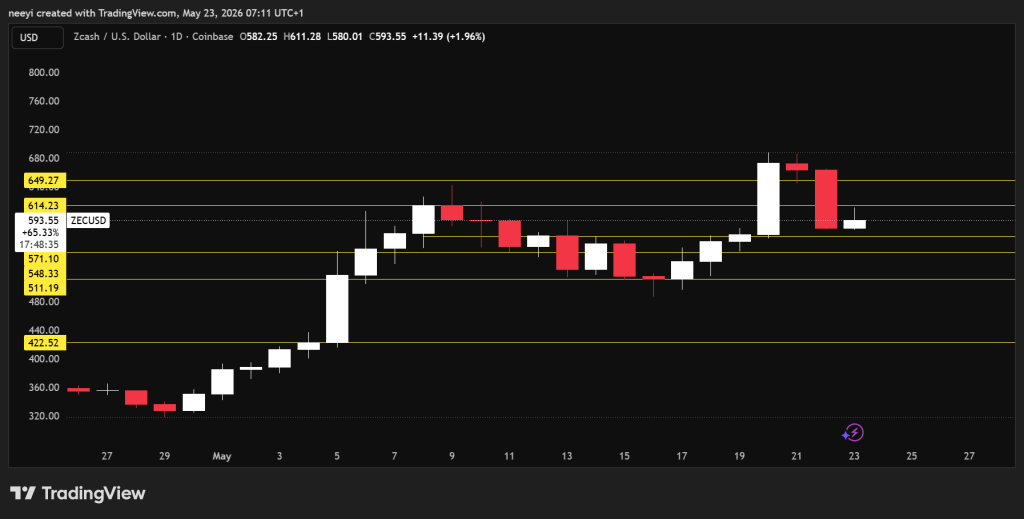
Zcash Price Risks Further Weakness Below Key Resistance
Zcash price has also entered an important stage after recent weakness pulled the asset nearly 15% lower from its high near $687. Current price action now shows ZEC testing resistance around the $614 region.
A failure to reclaim that zone could keep downside pressure active. ZEC price may continue moving lower toward the $571 support level. Additional weakness could later expose the $548 area. Extreme downside pressure could even push the asset toward $511 if market conditions worsen further.
Indicator readings currently present a mixed picture for Zcash.
The Relative Strength Index stands at 60.288. That reading still supports bullish strength despite the recent correction.
The Stochastic indicator currently reads 50.073. Current conditions now appear more neutral after recent volatility.
MACD readings remain positive at 26.11. That setup still supports the possibility of bullish continuation if buyers regain control.
The Ultimate Oscillator currently sits at 47.653. That reading leans slightly bearish despite stronger readings from some other indicators.
| Name of Indicator | Metrics | Interpretation of Readings |
|---|---|---|
| RSI(14) | 60.288 | Buy signal still supports bullish strength |
| STOCH(9,6) | 50.073 | Neutral reading shows market indecision |
| MACD(12,26) | 26.11 | Positive momentum still favors buyers |
| Ultimate Oscillator | 47.653 | Sell signal points toward caution |
Zcash (ZEC) Price Prediction for Today
The bullish scenario currently appears less likely unless ZEC price breaks above the $674 level. That move could open the path toward fresh highs later today.
The neutral scenario remains the most likely outcome for Zcash price today. Current market conditions support a consolidation range between $648 and $571.
The bearish scenario activates if ZEC price falls below the $578 support zone. That breakdown could expose the market to deeper downside toward $548 and eventually $511.
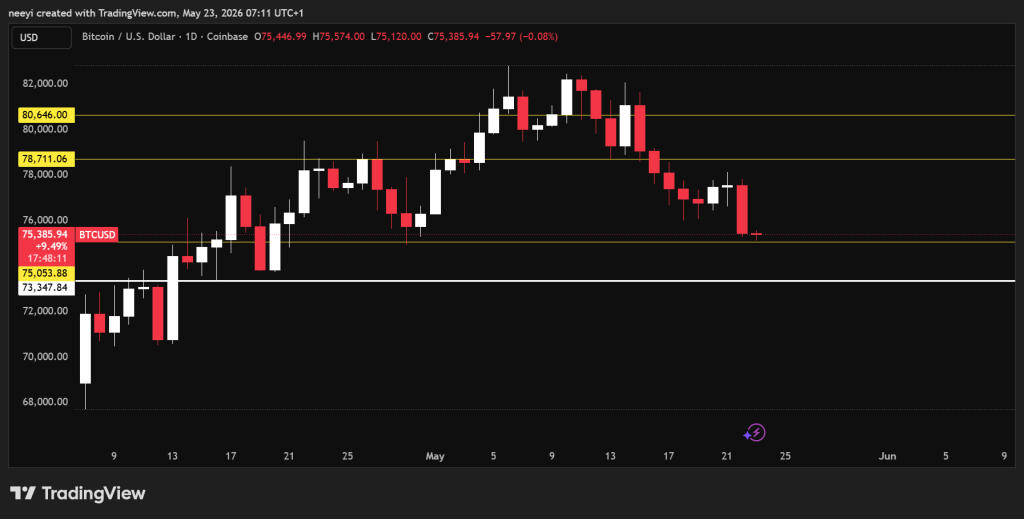
Bitcoin Price Struggles To Hold Major Support Near $75,000
Bitcoin price continues trading close to one of its most important support zones near $75,000. Recent weakness across crypto markets pushed BTC price lower after buyers failed to reclaim higher resistance levels.
A look at the BTC price chart shows the market attempting to stabilize around current support. Further downside pressure could still push Bitcoin toward the $73,000 region if sellers remain in control. Key resistance levels currently stand near $78,700 and $80,600.
The latest indicator readings still lean bearish overall.
The Relative Strength Index currently reads 41.456. That level shows weakening bullish momentum.
The Stochastic indicator stands at 98.587. Current readings now place Bitcoin in heavily overbought territory despite recent weakness.
MACD remains negative at -379.4. That reading continues supporting bearish market pressure.
The Ultimate Oscillator currently reads 41.683. That level still supports the cautious outlook for BTC price.
| Name of Indicator | Metrics | Interpretation of Readings |
|---|---|---|
| RSI(14) | 41.456 | Sell signal shows weakening strength |
| STOCH(9,6) | 98.587 | Overbought conditions may trigger volatility |
| MACD(12,26) | -379.4 | Negative momentum favors sellers |
| Ultimate Oscillator | 41.683 | Sell pressure remains active |
Bitcoin (BTC) Price Prediction for Today
The bullish prediction for Bitcoin price depends on a breakout above the $78,700 resistance zone. That move could completely change short term market sentiment and support stronger upside continuation.
The neutral prediction remains a continued trade between $75,000 and $78,700. Current conditions still support that consolidation scenario for now.
The bearish prediction becomes active if BTC price breaks below the $75,000 support level. That breakdown could expose the market to another decline toward $73,000.
FAQs
Subscribe to our YouTube channel for daily crypto updates, market insights, and expert analysis.