Gold Price Alert: Up 42% in a Year – And It’s Still the Discount Option as Money Printing Rages
Gold started 2026 with one of the strongest rallies seen in decades. The precious metal climbed to a record high of $5,608.35 per ounce in January before pulling back sharply toward the $4,500 zone. Even after that correction, gold remains nearly 38% higher than it was at the same time last year.
That massive move has pushed investors to ask a difficult question. If gold already climbed more than 40% in a year, why are some analysts still calling it cheap?
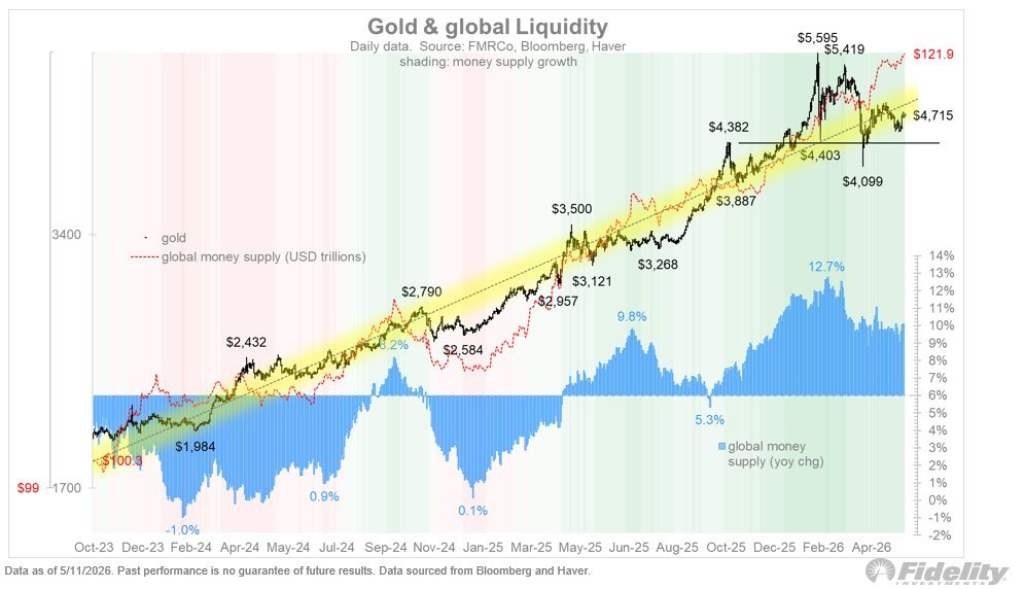
A chart shared by Rand Group attempted to answer that question directly. The firm posted a Fidelity chart showing the relationship between gold prices and global money supply growth. Rand Group wrote:
“Gold is up 42% in a year and it’s the DISCOUNT option. That’s how fast they’re printing.”
The chart paints a bigger picture than price alone. Fidelity’s data compares gold against global money supply expansion measured in trillions of dollars. The red dotted line tracks global liquidity growth, while the black line tracks gold prices over time. Recent data shows money supply growth accelerating toward double digit levels again after slowing in late 2024.
A closer look at the Fidelity chart reveals why some macro analysts still believe gold has room to rise despite its historic rally.
Global money supply growth dropped below zero briefly during 2024. Gold consolidated during that period and traded close to $2,000 before starting another major advance. Liquidity conditions then began improving again across major economies. The chart now shows global money supply growth back above 9%.
Gold followed that liquidity rebound closely.
The black price line climbed from below $2,000 in late 2023 to above $5,500 at the peak earlier this year. Fidelity’s shaded trend channel suggests gold continues tracking long term liquidity expansion despite recent corrections.
That relationship matters because gold historically performs well during periods of aggressive monetary expansion. More money entering the financial system often weakens purchasing power across fiat currencies over time. Gold tends to benefit because investors treat it as a scarce asset that governments cannot print endlessly.
Rand Group’s argument centers on that exact idea. Gold may look expensive in nominal dollar terms. Yet relative to the scale of global liquidity growth, some analysts believe the metal still trades below where macro conditions could eventually push it.
What you'll learn 👉
Central Bank Demand And Currency Debasement Continue Supporting Gold Prices
Several major macroeconomic forces continue supporting the long term gold price outlook for 2026.
Central bank buying remains one of the biggest drivers. Countries such as China, India, and Türkiye continue adding physical gold reserves while reducing exposure to U.S. Treasuries. That trend accelerated after Western sanctions reshaped global reserve management strategies during recent geopolitical conflicts.
Currency debasement also continues drawing attention. Global debt levels remain extremely high across developed economies. Many investors now view gold as protection against weakening fiat purchasing power. A weaker U.S. dollar also improves demand because foreign buyers can purchase gold more cheaply in local currency terms.
Geopolitical instability remains another major factor. Wars, trade disputes, and election uncertainty often push institutional capital toward defensive assets. Gold has historically benefited during those periods because investors view it as a store of value during uncertain economic cycles.
Interest rate policy could also play an important role during the second half of 2026. Gold competes against yield-bearing assets such as bonds. Lower rates reduce the opportunity cost of holding gold. Real interest rates become especially important when inflation remains above nominal yields. Cash and bonds lose purchasing power under those conditions. Gold often becomes more attractive during those environments.
Another factor deserves attention. Mining supply growth remains extremely limited. New gold production only expands around 1% to 2% yearly. New discoveries require years of development and massive capital investment. Supply cannot quickly respond when global demand rises sharply. That imbalance often places upward pressure on prices over extended periods.
Major Banks Still Expect Gold Prices To Move Higher During 2026
Several major financial institutions still expect higher gold prices despite recent pullbacks.
J.P. Morgan maintained its ambitious $6,000 year end target for gold. The bank reduced its full year average forecast to $5,243 because of softer near term investor demand. Analysts still expect demand to recover aggressively during the second half of 2026.
Read Also: Why Is ONDO Price Up? SEC’s Tokenized Stock Exemption Could Be the Catalyst
UBS projects gold could reach $5,900 as the United States moves closer to the midterm election cycle. Political uncertainty and fiscal spending trends remain central parts of that bullish outlook.
ANZ maintains a $5,600 target despite trimming expectations slightly due to recent U.S. dollar strength.
Those forecasts suggest Wall Street still sees structural support underneath the gold market even after one of the strongest yearly rallies in modern history.
FAQs
Subscribe to our YouTube channel for daily crypto updates, market insights, and expert analysis.