Silver is pushing higher, up nearly 6% to around $76.9 on May 6, 2026, as a 12% drop in oil helped lift commodities and risk assets. This move is happening because supply is getting even tighter. Glencore’s Kazzinc facility lost 3.4 million ounces of yearly output. That adds more pressure to a market already short by 215 million ounces this year.
People still want the metal. COMEX deliveries hit 24.645 million ounces in May. And even with bond yields staying high and putting pressure on prices, silver is holding above the $70 base. Analyst Ian Cooper points to a tightening wedge structure, with compression now in play. That setup, combined with steady demand, leaves the silver price nearing a key decision zone.
🚨3.4M OZ OF ANNUAL SILVER PRODUCTION GOES OFFLINE AFTER MASSIVE EXPLOSION & FIRE
— SilverTrade (@silvertrade) May 5, 2026
💥GLENCORE'S KAZZINC – KAZAKHSTAN'S LARGEST PRODUCER OF ZINC, LEAD, COPPER, GOLD, & SILVER SUFFERS DEADLY EXPLOSION
⚡️KAZZINC FACILITY PRODUCES 3.4 MILLION OZ OF SILVER/ YEAR
🚨Two workers were… pic.twitter.com/nLrbXHZHwM
What you'll learn 👉
Silver Price Compression Builds Pressure for a Breakout
Macro analyst Sunil Reddy lays out the big picture. Silver has been stuck in a tight range for weeks, even while bond yields keep climbing. Higher yields usually pull money out of the market and hurt assets that don’t pay anything back, like metals. But silver is still holding the $70 level firmly. That repeated defense of support tells you people are buying the dips, not dumping the metal.
The chart backs that up. Silver peaked near $121.64 in late January 2026, then corrected by as much as 35% – 48%, before stabilizing. The range between roughly $70 and $80 has now tightened for about eight weeks. Volatility is shrinking. That usually means a big move is coming.
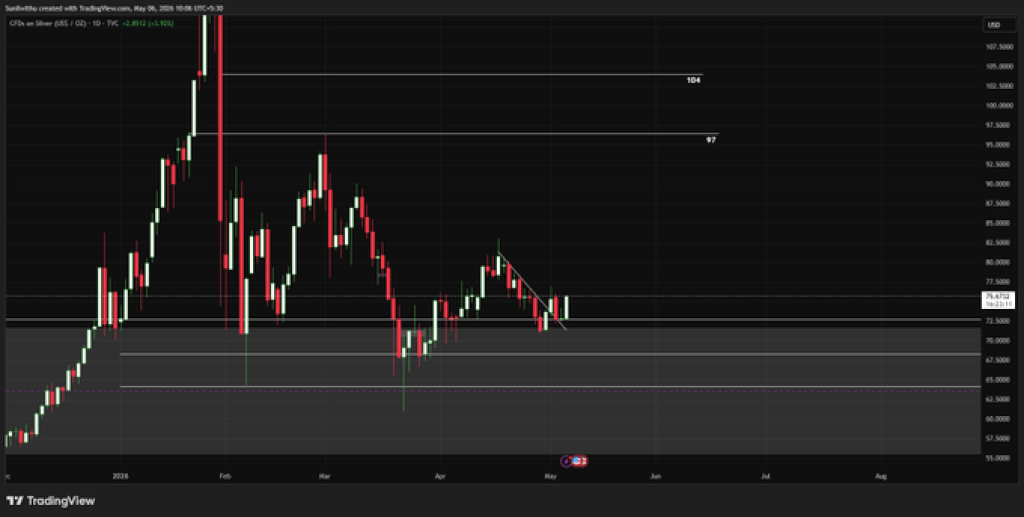
Ian Cooper’s wedge pattern is inside this broader range. Each lower high and higher low reduces available space, forcing a resolution. A break above resistance near $80 would confirm bullish continuation and bring the $95–$104 zone into play, which aligns with Reddy’s minimum upside target. That range also overlaps with institutional forecasts, with Goldman Sachs placing silver between $85 and $100.
Market flows add another layer to this setup. Open interest and ETF activity show mixed behavior. Data shared by SilverTrade notes retail investors have been selling silver ETFs even as the silver price moves through $78. If that selling pressure fades, it removes a key source of supply and could accelerate upside. Also, COMEX delivery data shows 24.645 million ounces issued in May, a sign of strong physical demand.
There is also a supply-side factor developing. A reported explosion at Glencore’s Kazzinc facility in Kazakhstan has taken 3.4 million ounces of annual silver production offline. With 2026 already projected to record a 215 million ounce supply deficit, the largest on record, disruptions like this tighten an already constrained market.
Factors Affecting the Silver Price
Silver’s price depends on two things: how much factories need it and how the economy is doing. More than half of all silver demand comes from industry, things like solar panels, electronics, and electric cars.
Solar panel makers alone are expected to use nearly 650 million ounces in 2026. That number is down just 2%–3% because panels are getting more efficient. Still, that’s a lot of silver. So demand stays high.
People are also buying more silver as an investment. Physical silver in coins and bars should grow 20% this year to 227 million ounces. Money flowing into silver ETFs has been all over the place. In January 2026, it jumped 139% from the month before. Even with regular folks selling some of their silver lately, the bigger picture shows money moving into silver when things feel uncertain.
🔥725k OZ OF COMEX SILVER DELIVERIES ISSUED MONDAY‼️
— SilverTrade (@silvertrade) May 6, 2026
🏦COMEX SILVER DELIVERIES REPORT🏦
💥RBC Cap's HOUSE Account Issued All 145 Notices
➡️Stonex' HOUSE Account Stopped 28
➡️Wells Fargo's HOUSE Account Stopped 23
➡️Scotia's HOUSE Account Stopped 26
➡️BNP Paribas' HOUSE Account… pic.twitter.com/KvptqyBrm2
The economy still drives the price. When the Federal Reserve started cutting rates in early 2026, silver shot up to $120. Then the Fed changed its tone and sounded more careful about future cuts. That cooled things down. Bond yields are still high, and that holds silver back for now. But if yields stop rising, that pressure fades and metals could do better.
Geopolitical developments are also in play. Updates from The Kobeissi Letter and Ash Crypto indicate the US and Iran are nearing a deal that includes sanction relief and a pause on uranium enrichment. That could reduce immediate safe-haven demand, though easing tensions may also support global growth expectations, which benefits industrial metals demand.
BREAKING: The US and Iran are nearing a 14-point "memorandum of understanding" to end the Iran War and set a framework for more detailed nuclear deal.
— The Kobeissi Letter (@KobeissiLetter) May 6, 2026
The deal would include:
1. Iran committing to a moratorium on uranium enrichment
2. The US lifting its sanctions and releasing…
Regional demand adds another dimension. Numbers from SilverTrade show silver in Shanghai closed up 5.85% at $85.97 after the markets came back from break. Inventory climbed to 767,072 kilograms, which is about 24.66 million ounces. That tells you Asian markets are busy. They still drive a big part of physical demand.
Read Also: Solana Returns to Zone That Triggered 20X Rally; How High Can SOL Price Go This Time?
Silver Price Prediction: Where the Move Could Go Next
The likely path. Price stays stuck between $70 and $80. The wedge keeps getting tighter. Pressure keeps building. When resistance finally gives, the breakout should be strong.
The bullish path. Price clears $80 for real. The first target is $95. Then $104 after that. That matches both the wedge breakout and what Sunil Reddy said. For this to happen, bond yields need to stop climbing, money needs to stop leaving ETFs, and physical demand must hold up.
The bearish path. Price falls below $70. That breaks the whole wedge setup.Then the silver price heads to the mid $60s. That would probably take a big jump in bond yields or a much stronger dollar. Either one would hurt metals.
Here’s the thing. Silver has spent eight weeks squeezing inside a clear range. Strong support at
$70. Resistance near $80. Supply is tight. Demand is steady. The chart is coiling up. Once this range breaks, prices could move fast.
Frequently Asked Questions
Subscribe to our YouTube channel for daily crypto updates, market insights, and expert analysis.