BNB Price News: $12,000 Target Circulates – Here’s What the Real Upside Looks Like From $617
Binance Coin (BNB) is moving through a phase where utility is expanding beyond trading, and the data is starting to back it up. Today, crypto card spending hit $606 million, with BNB Chain capturing 15% of that volume, pointing to real-world payment usage.
Yesterday, PancakeSwap rolled out tokenized stocks and ETFs through xStocksFi, bringing over 60 traditional assets on-chain. On April 25, Teucrium launched the first U.S.-traded 2x leveraged BNB ETF, opening a new route for institutional exposure.
With the BNB price trading around $617–$618, the key question this week is how much upside remains from this level if momentum builds or fades.
What you'll learn 👉
The $12,000 BNB Price Call
Crypto Patel’s $300 to $12,000 projection is built on a mix of narrative, adoption metrics, and tokenomics, though the jump itself needs context. The core argument centers on BNB being deeply integrated into multiple high-value sectors at once.
The mention of BlackRock’s BUIDL, Franklin Templeton’s BENJI, and VanEck’s VBILL being live on BNB Chain ties the network directly to tokenized real-world assets. That matters because RWA infrastructure is becoming a major focus for institutions.
Add the Teucrium 2x leveraged ETF launched on April 25, 2026, and it shows traditional finance is finding structured ways to interact with the BNB price.
Then there’s the supply side. BNB’s auto-burn mechanism removes over $1 billion worth of tokens quarterly, creating a consistent reduction in circulating supply. That’s a strong structural driver, especially if demand keeps growing.
Top analyst Patel also points to transaction activity, claiming around 31 million daily transactions and a large share of global stablecoin volume, which supports the idea of real usage.
The more aggressive claims, like Bhutan holding BNB as a sovereign reserve or 30+ public companies building treasury exposure, push the narrative further into speculative territory.
Even if parts of that materialize, the jump to $12,000 would require a huge expansion in market cap, far beyond current levels. The takeaway isn’t the number itself, it’s the setup: high usage, deflationary mechanics, and growing institutional overlap.
Catalysts Pushing the BNB Price
The BNB price is supported by multiple active drivers across payments, real-world assets, ETFs, and network upgrades, all feeding into one ecosystem.
On payments, crypto card spending reached $606 million in March 2026, with BNB Chain accounting for about 15% of activity. That shows consistent use in real-world transactions, not limited to trading activity. Visa handles about 90% of this flow, linking traditional payment rails with on-chain settlement.
Real-world assets are now part of the chain’s core activity. On May 2, 2026, PancakeSwap integrated xStocksFi, giving access to over 60 tokenized stocks and ETFs. Assets like equities can now be traded directly on-chain, increasing transaction activity across DeFi pools and expanding fee generation inside the ecosystem.
Institutional access continues to open up. Teucrium launched a 2x leveraged BNB ETF on April 25, 2026, listed on NYSE Arca. This creates a regulated route for traditional investors to gain exposure to the BNB price. Also, Nasdaq’s earlier filing for a spot ETF keeps institutional interest active, even with delayed approval timelines.
Network development also plays a key role. The 2026 roadmap targets 20,000 transactions per second with sub-second finality, building on earlier upgrades that reduced block times to 0.45 seconds and lowered fees. Work on AI agent tools and privacy functions expands what developers can build on the chain, especially for automated and enterprise use cases.
Token supply continues to tighten through auto-burns that remove over $1 billion worth of BNB every quarter. That mechanism runs alongside whale accumulation between $620 and $660, where large holders have been steadily adding exposure while also managing risk through derivatives.
The combination of real usage, regulated access, supply reduction, and infrastructure expansion keeps the BNB price supported across different layers of demand.
What the Binance Coin Chart Is Showing
We had a look at the chart shared by Crypto Patel, and the long-term structure stands out immediately. The BNB price moved from under $100 in earlier cycles to peaks near $600–$700, establishing a strong macro uptrend. That historical move is part of what fuels calls for another exponential leg higher.
Also, the chart shows clear consolidation around the current range. BNB is holding near $617, with repeated reactions around that level. This points to a stable base, supported by accumulation, though it also shows that buyers haven’t pushed price into a new expansion phase yet.
Read Also: Everybody’s Celebrating LUNC’s 118% Pump – But Terra Classic Is a Dead Chain with No Floor
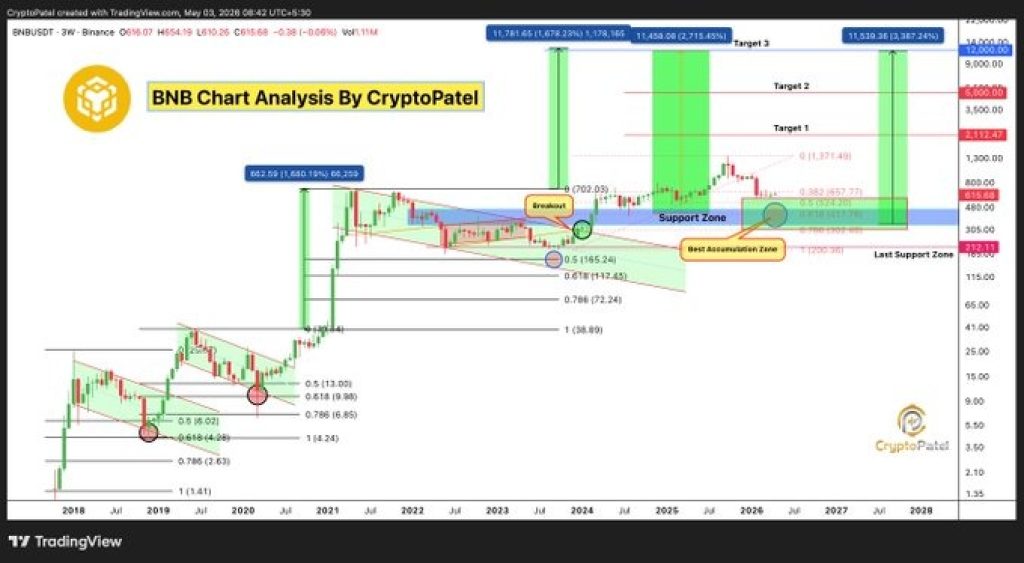
Momentum indicators suggest a balanced market. There isn’t a strong breakout signal, though there’s also no sign of heavy distribution. This kind of structure often leads to gradual movement rather than explosive rallies unless a strong catalyst enters the market.
The broader takeaway from the chart is that BNB is not in a discovery phase yet. It’s in a consolidation phase within a larger uptrend. That distinction matters because moves to extreme targets like $12,000 typically require a clear breakout into new territory, not just continuation within an existing range.
Binance Coin (BNB) Price Prediction
All three scenarios start from the $617 base, which acts as the current market pivot for the BNB price.
The most likely thing for BNB is slow and steady. Maybe boring. As long as the price stays above $600, the market can crawl toward $700 or $750. That is especially true if new things keep happening in the ecosystem and people keep wanting in.
The bullish case needs a clean break above the old highs. If BNB clears the $700 to $750 zone with a lot of volume behind it, the road opens to $900. Maybe even $1,000 before this cycle ends.
The bearish case comes into play if the $600 level fails. A breakdown there could send the BNB price back toward $520–$550, where previous support formed. This scenario becomes more likely if broader market strength weakens or if regulatory pressure increases.
However, BNB setup is strong, with real usage, aggressive token burns, and expanding institutional links supporting the long-term outlook. The $12,000 target captures attention, though it stretches far beyond what current market structure supports.
The BNB price is holding a solid base near $617, though it hasn’t entered a breakout phase yet. That keeps expectations grounded in the short term.
What matters now is execution. If the roadmap delivers and adoption continues, upside remains open. If not, the market stays range-bound until a clearer trend forms.
Frequently Asked Questions
Subscribe to our YouTube channel for daily crypto updates, market insights, and expert analysis.