
Gold started the week with a quick drop, but it didn’t stay down for long. The price fell to around $5,014 early on, then bounced back as buyers stepped in.
Right now, the market is mostly watching one area, $5,140 to $5,150. How the gold price behaves around that level could decide what happens next.
This area has turned into an important decision point where the next short-term move could begin.
Some analysts see the current movement as a simple correction after the previous rally, while others think the market is building momentum for another push higher.
What you'll learn 👉
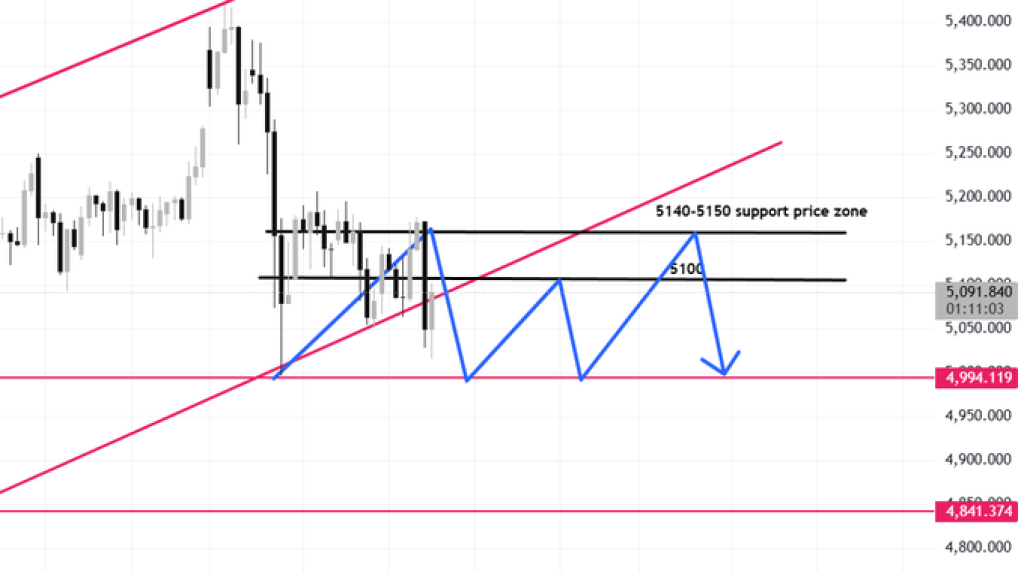
Analysts Watching Key Zones For Gold Price
Market analyst Shirley pointed out that gold has already tested the $5,014 area, which acted as a temporary low during the recent correction.
From her perspective, the market is now approaching resistance around $5,140–$5,150. If the price reaches that area again, she believes traders could look for short-term selling opportunities.
The first downside targets she mentioned sit around $5,060, followed by deeper levels near $5,040 and $5,030 if selling pressure increases.
She also highlighted another short-term resistance near $5,100, where small sell orders could appear if the gold price fails to break higher. Overall, her view is that the market is moving through a correction phase rather than a new trend.
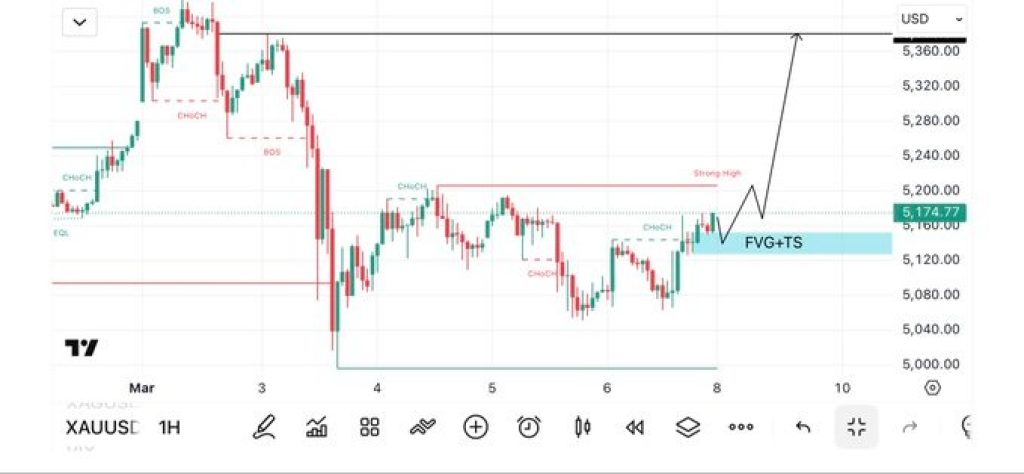
Gold Chart Shows Bullish Structure Still Intact
Another analyst, Elena, sees the situation differently. Her chart shows that gold still holds a bullish structure on the 1H timeframe after a strong impulsive move from the recent lows.
According to her analysis, the price is respecting a support area between $5,150 and $5,160, which aligns with a fair value gap and trend support zone.
As long as that area holds, buyers could attempt another push higher. In that scenario, the first upside level to watch would be $5,200, which acts as the next resistance on the chart.
However, these charts illustrate how gold recovered from the $5,000 region, forming higher lows.
One of these charts depicts a strong move up after a change of character (CHoCH) signal, which is a technical indicator of interest among traders.
Another chart depicts a range in which there has been a bounce between support at $5,000 and resistance at $5,150.
This is why analysts believe that $5,150 is a significant price point. If it is breached, it could lead to a move down into the range of $5,060 to $5,030, or it could lead to even higher targets.
Read Also: Here’s Where Silver Price Could Be Headed This Week
Key Gold Price Levels to Watch
For the time being, the level of $5,150 is the most important level on the chart.
If the price of gold is unable to break through the level of $5,150, the price of gold might fall back down towards the level of $5,060, followed by the levels of $5,040 and $5,030.
On the other hand, if the buyers are able to push the market price above the level of $5,200, the price might gain momentum and the level of $5,360 might come back into the picture, which is the previous strong high.
Subscribe to our YouTube channel for daily crypto updates, market insights, and expert analysis.