
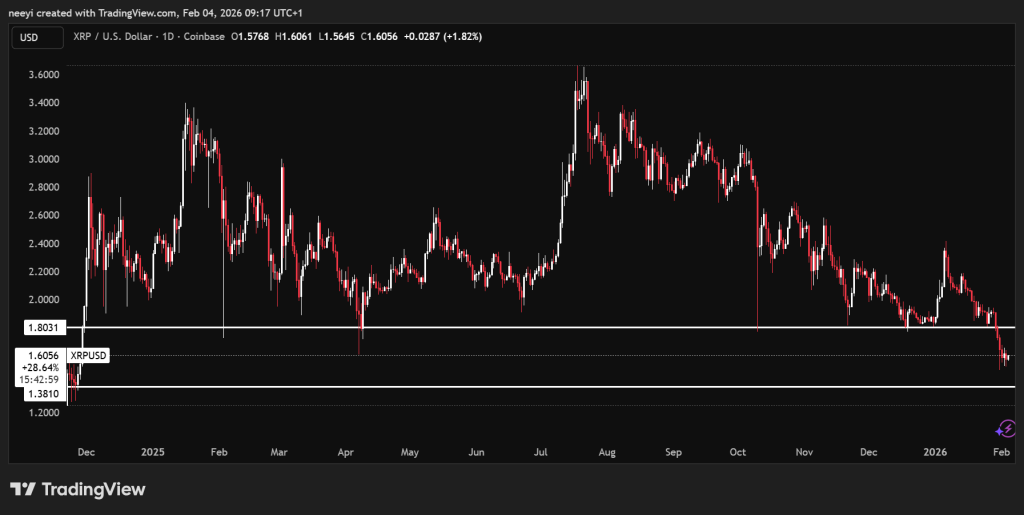
XRP price entered February under clear pressure as the broader crypto market stayed weak. Ripple price broke below the $1.8 support zone on January 30. That break changed the structure fast.
Selling pressure pushed XRP price down to $1.5 before a mild recovery lifted it closer to $1.6 at the time of writing. The rebound looks modest and fragile. The bigger question now revolves around whether February brings relief or deeper stress.
The loss of the $1.8 level marked a critical moment for XRP price. That area had acted as a firm floor during earlier pullbacks since 2024. Once price slipped below it, downside momentum accelerated. XRP price moved into a lower range with fewer nearby support zones.
Market sentiment across crypto has also stayed negative. Bitcoin price weakness has weighed heavily on altcoins. XRP tends to feel that pressure quickly during market downturns. The recent slide reflects that sensitivity. Until Bitcoin price finds stability, XRP price remains exposed to further downside risk.
What you'll learn 👉
XRP Price Prediction For February Starts With a Possible Rebound
A short-term rebound remains possible during February. XRP price could attempt to retest the broken $1.8 zone. That move would act as a technical reaction after the sharp drop. What happens near that level will matter more than the rebound itself.
A clean recovery above $1.8 would improve the XRP price outlook. That scenario could open a path toward the $2 area later in February. Such a move would likely require broader strength across the crypto market. Current conditions make this outcome less likely.
XRP Price Outlook Favors Consolidation Or Further Weakness
The more realistic XRP price prediction points toward consolidation. Price could oscillate between $1.5 and $1.8 as the market searches for direction. This range may hold for weeks if selling pressure cools and Bitcoin price stabilizes.
A darker scenario remains on the table. Continued weakness in Bitcoin price could drag XRP lower. A move toward the $1 level becomes possible under sustained market stress. February has already started with fragile momentum. Any renewed selling wave could test lower supports quickly.
XRP Technical Indicators Support A Bearish Bias
Technical readings on the weekly chart lean bearish. Momentum indicators show limited strength behind the recent bounce. Selling pressure still dominates the broader trend.
| Name | Value | Action |
|---|---|---|
| RSI(14) | 35.402 | Weak momentum favors sellers |
| STOCH(9,6) | 38.5 | Recovery attempts remain limited |
| MACD(12,26) | -0.178 | Downtrend pressure persists |
| ADX(14) | 42.55 | Strong trend with bearish control |
| Ultimate Oscillator | 38.161 | Buying strength remains muted |
These readings align with the consolidation or downside scenarios. XRP price needs stronger momentum signals before confidence can return.
Read Also: Why a $74,000 Bitcoin Price Will NOT Force Strategy to Sell BTC
February may test patience for XRP holders. Watching how price behaves near $1.8 could reveal whether relief or deeper weakness lies ahead.
Subscribe to our YouTube channel for daily crypto updates, market insights, and expert analysis.