Bitcoin might be quietly doing something important right now. While price action still looks messy on the surface, on-chain data is starting to tell a calmer story.
A signal shared by Crypto Patel shows the Short-Term Holder Supply Ratio flipping back above break-even, a move that has historically appeared before some of Bitcoin’s strongest rallies.
What you'll learn 👉
Reading the BTC Chart Step by Step
The chart titled “The Bitcoin Bottoming Process” shared by Patel puts two things together: the BTC price at the top and short-term holder profit and loss behavior underneath.
Short-term holders are investors who bought Bitcoin within the last 155 days. They are usually the first to panic and the first to sell when markets turn against them.
Earlier in the year, the BTC price fell hard from above $100,000 into the $74,000 to $84,000 zone. That drop pushed short-term holders deep into loss territory, even close to the extreme -95% loss level. This was the phase labeled as the “tariff bottom,” where forced selling peaked and fear clearly took control.
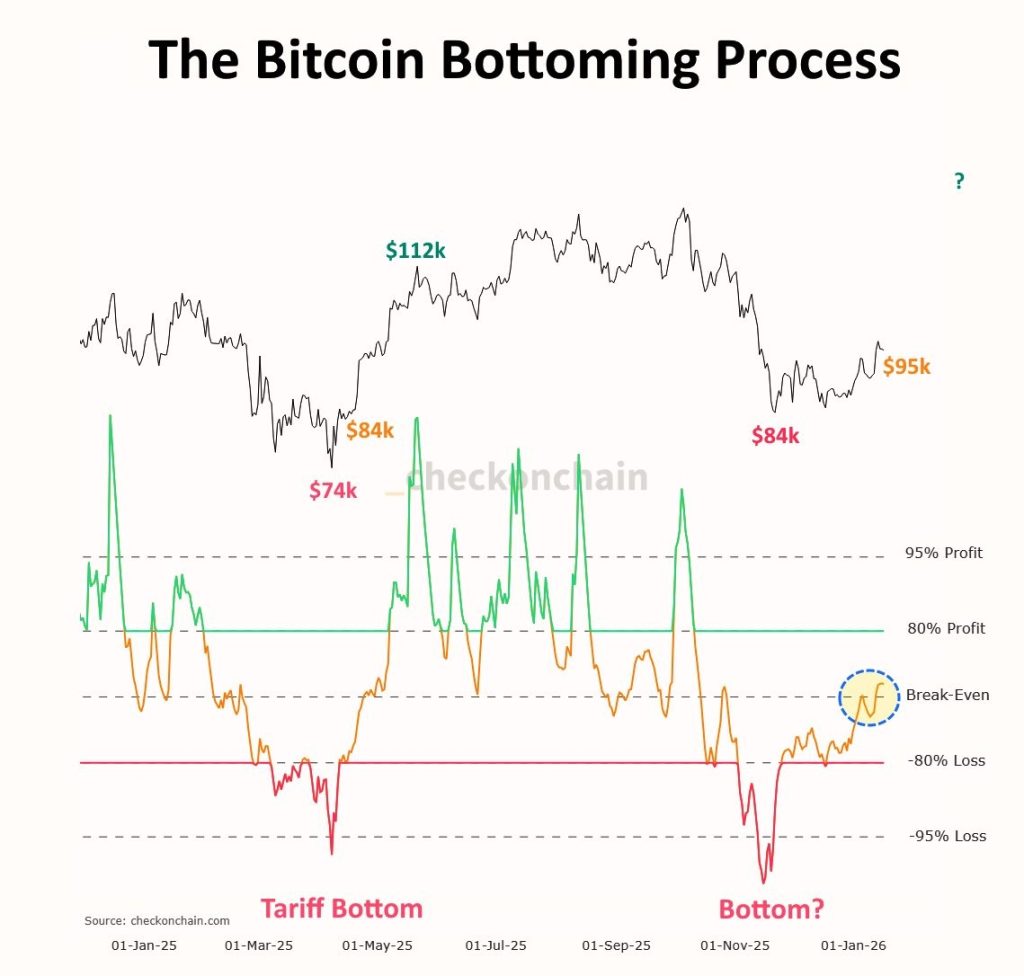
Later on, the BTC price returned to the $84,000 area again. On the surface, it looked like another major breakdown. But under the hood, the reaction was different.
Losses were sharp but short-lived, and the recovery in the short-term holder metric happened much faster. That tells us a lot of weak hands were already shaken out during the first sell-off.
Why Break-Even Is a Big Deal
The key moment on the chart is the recent move back above the break-even line. This is where things start to change. When short-term holders are sitting at a loss, every bounce in the BTC price becomes an excuse to sell. That creates constant overhead pressure and keeps rallies from going very far.
Once those holders move back into profit, that pressure fades. Panic selling slows down, fewer coins hit the market, and supply tightens naturally.
The chart shows that in previous cycles, similar flips above break-even didn’t mark tops. They usually showed up before sustained moves higher in the BTC price. That doesn’t mean Bitcoin goes straight up from here. In the past, this phase often came with sideways action and a few pullbacks before momentum fully returned.
Read Also: Bear Market Warning: Bitcoin Faces Major Test That Defined the 2022 Crash
What This Could Mean Next for the BTC Price
From an on-chain perspective, Bitcoin looks more like it’s stabilizing than breaking down. As long as the BTC price stays above recent lows and short-term holders remain in profit, selling pressure should stay limited.
Macro conditions and sentiment still matter, but this chart indicates the worst of the panic may already be behind us. If history repeats, this break-even flip could be less about a short-term bounce and more about laying the foundation for the next major move in the BTC price.
Subscribe to our YouTube channel for daily crypto updates, market insights, and expert analysis.