
Ripple’s XRP starts the week with a mix of big updates and fresh uncertainty. Bitwise launched its new XRP ETF, bringing in over $100 million and giving traditional investors an easier way to buy the asset.
Ripple also finished its GTreasury integration, putting XRP inside a system used by large companies to move and manage huge amounts of money.
At the same time, some analysts warn that a quick drop toward $1.98 could still happen. All of this leaves XRP in a moment where the next move could come fast.
What you'll learn 👉
What the XRP Chart Is Showing
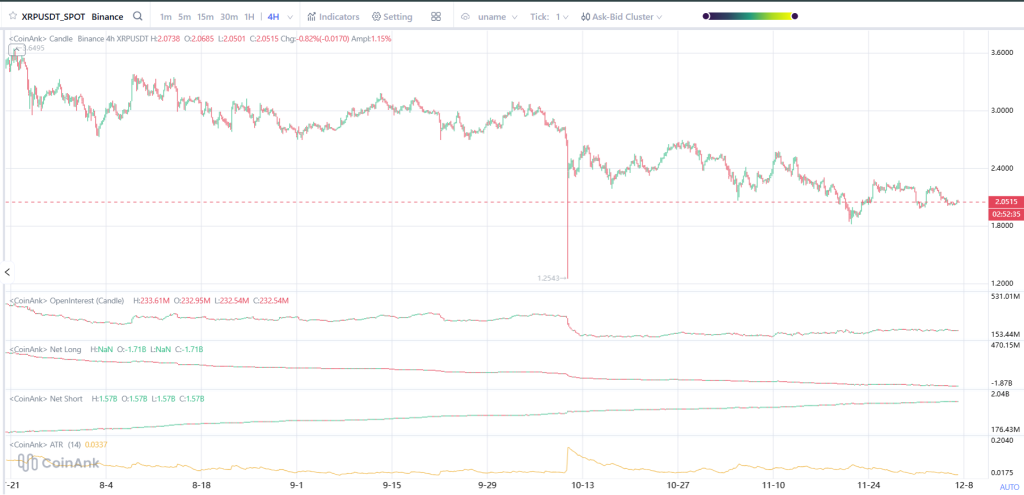
On the 4H chart, XRP has been falling from its early November peak near $2.40 and now sits around $2.05, making lower highs with weaker buying pressure.
The biggest move on the chart is the sharp drop in mid-October, when price fell straight to about $1.25 before bouncing back.
Since then, the XRP price has failed to reclaim any meaningful trend structure. It now trades sideways with a slight downward tilt.
The chart also shows repeated rejection near $2.20, which has become a firm resistance zone. Buyers have attempted several recoveries, but each push weakened faster than the previous one.
That indicates exhaustion from long-side traders and suggests the market lacks aggressive spot demand.
The red dashed level around $2.05 is acting as a temporary balancing point rather than real support. A decisive move below it opens the path toward the liquidity cluster at $1.98 that analysts have been talking about.
Market Indicators
Open interest has been falling steadily since October’s drop. This shows that traders are not re-entering with conviction on either side and that speculative leverage is leaving the market.
The ATR at the bottom of the chart remains low, showing volatility compression. This usually precedes a strong move, but the chart does not yet reveal direction.
Low ATR combined with falling open interest often means market makers are preparing to seek liquidity – usually at obvious levels like $1.98.
Net long and net short positions remain almost identical for weeks, suggesting indecision. When this happens, price often gravitates toward areas where stop losses are concentrated.
XRP Price Short-Term Outlook for This Week
If XRP loses $2.05 with force, the next stop is almost certainly $1.98. A fast dip into that zone could create the flash-crash scenario analysts warned about.
Paradoxically, that may be exactly what the XRP price needs to reset leverage and form a stronger base. If a wick into $1.98 is met with heavy buying, price could rebound quickly toward $2.12 and $2.20.
On the upside, XRP must reclaim $2.20 to break the sequence of lower highs. Only then does a move toward $2.35 become realistic. Without that reclaim, the structure remains weak.
The combination of ETF approval, real-world utility expansion, and looming liquidity traps makes this a pivotal week.
The XRP price sits at the edge of both risk and opportunity. Whether it breaks down or springs higher will depend on how the price reacts the moment it touches the liquidity at $1.98.
Read Also: Uniswap (UNI) Charts Signal Breakout Structure as Analysts Spot Strength on Higher Timeframe
Subscribe to our YouTube channel for daily crypto updates, market insights, and expert analysis.