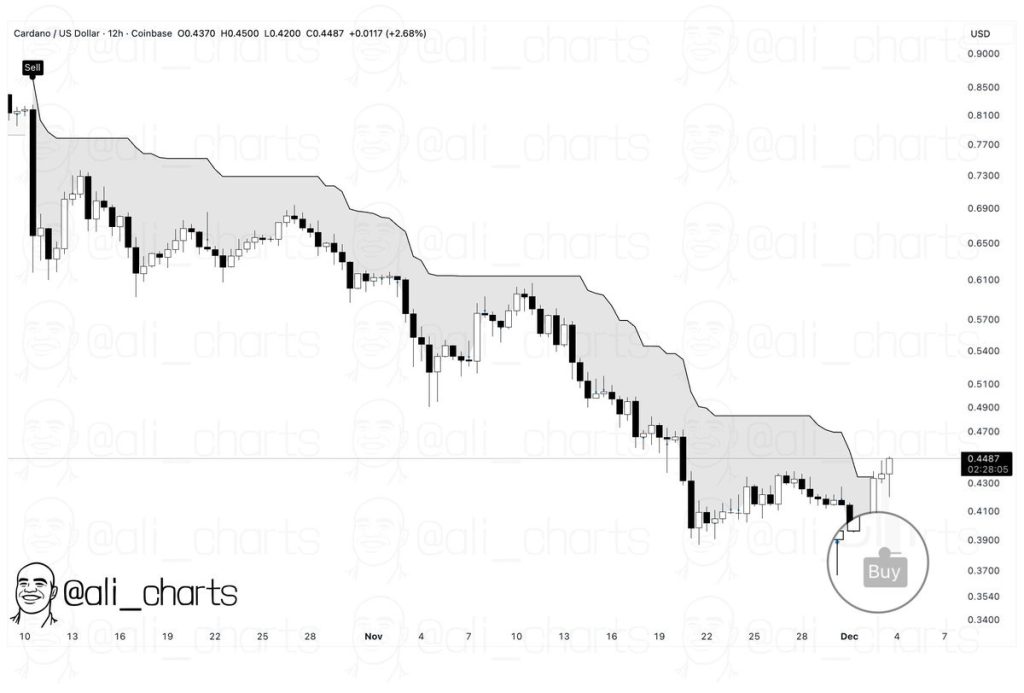
Cardano finally printed a clean bullish signal on the 12-hour chart. Analyst Ali Martinez highlighted that the SuperTrend indicator has flipped to a “buy,” something ADA hasn’t seen since its broader downtrend began.
On the ADA chart, price has broken above the shaded resistance zone for the first time in weeks, indicating momentum could be turning toward buyers after a long stretch of selling pressure.
This signal usually appears when a trend is reversing or when early upside strength becomes strong enough to break through multi-week resistance.
The recent reclaim of the $0.43–$0.44 region reinforces that idea, showing that buyers stepped in aggressively after last week’s sweep below the support zone. The ADA price now trades around $0.446, holding above the previous demand block highlighted on the charts.
What you'll learn 👉
ADA Price Recovers from Support With Volume Uptick
The chart from Ali shows how the Cardano price bounced sharply from a key horizontal support level, marked around $0.40.
That area has acted as a major defense zone for weeks. Each time the price dipped below it, buyers pushed back quickly, forming higher local lows on shorter timeframes.
Volume also increased during the most recent rebound, hinting that the reaction wasn’t just a relief bounce but a possible shift in sentiment.
The ADA price is now trading directly beneath the 200-day moving average, a level that often behaves as dynamic resistance when a trend is still weak.
A clean break above this moving average would add confirmation to the SuperTrend signal and strengthen the bullish case heading into December.
ADA Price Nears the $0.50 Test
Analyst Sssebi pointed out that the ADA price is now heading toward the $0.50 region, a critical zone that has acted as resistance multiple times. It’s also where the current recovery rally will be tested.
The chart structure shows that the price has room to continue moving upward without being overextended, and the RSI supports that idea.
The indicator is climbing from oversold levels but has not yet reached conditions that typically signal local exhaustion. That means ADA still has space to make another leg higher before hitting resistance.
If ADA reaches the $0.50 zone, the market will likely see heavy reactions. A rejection would not be unusual given how important that level has been historically.
But if buyers manage to break through it with strong candle closes, momentum could turn “mega bullish,” as Sssebi described, opening the door for a larger trend reversal.
Read Also: ZCash (ZEC) Is Following Bitcoin Old Playbook: A ‘Violent’ Rebound Might Be Close
How high can ADA Go?
For now, ADA’s structure is improving. The SuperTrend buy signal gives bulls a clean technical trigger, the rebound from support looks healthy, and momentum indicators are aligning behind the move.
The $0.50 resistance remains the key area to watch. A break above it would finally put the ADA price back into a higher trading range and could mark the beginning of a broader recovery trend.
Subscribe to our YouTube channel for daily crypto updates, market insights, and expert analysis.