The crypto market is still under heavy pressure, and XRP continues to follow the broader downtrend. The token is trading near $1.92 after losing key supports earlier this week. According to analyst Casi, the correction is not finished yet — but the end may finally be close.
Her latest chart shows that XRP has now broken below the .5 Fibonacci retracement on Coinbase, which sat around $2.02. She warned in her earlier updates that losing this level would open the door to the next major support at the extended Wave 3 zone around $1.84. XRP hit that level perfectly, and Binance simultaneously touched its own macro .5 retracement at $1.88.
What you'll learn 👉
XRP Chart Structure Points to One More Down Move
The chart highlights a clear 5-wave corrective sequence. Wave 3 appears completed near $1.84, and the XRP price is now forming a temporary relief bounce as part of subwave 4. The bounce has clean resistance between $2.00 and $2.09, where both the shorter-term .382 and .5 retracements align.
Casi expects XRP to test this resistance before rolling lower again. The final target remains the macro .618 Fibonacci level at approximately $1.65. Multiple confluences support this zone:
- The .618 retracement aligns with the completion of Wave 5
- Strong historical demand sits near $1.65–$1.70
- The falling diagonal structure connects cleanly into this region
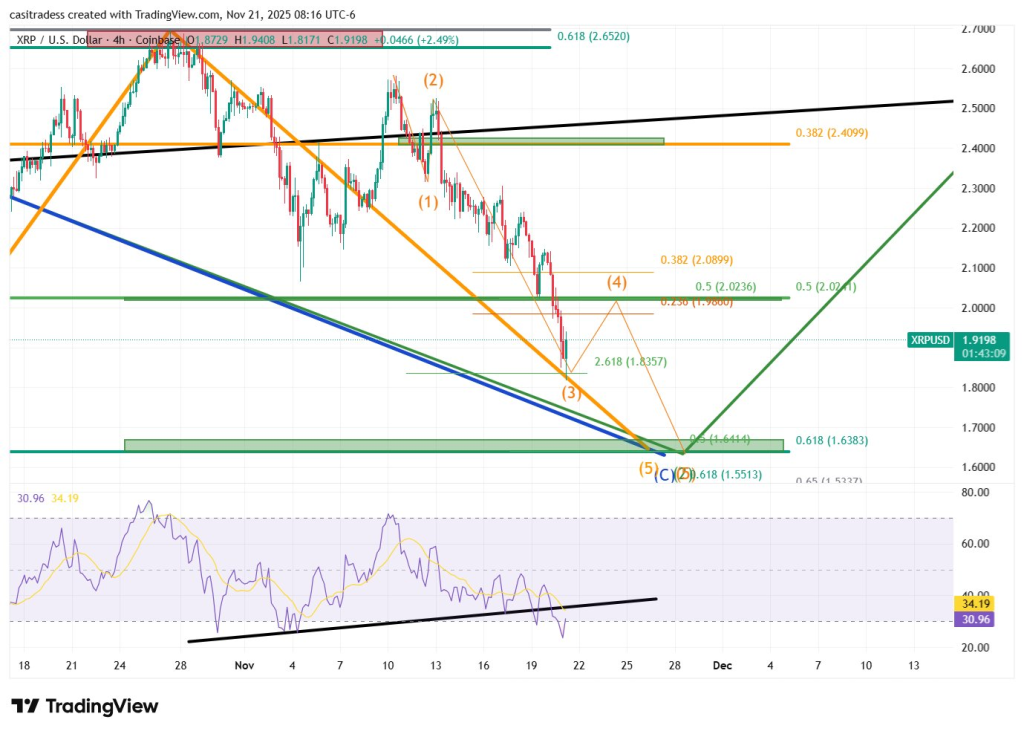
On her chart, this area is marked by a wide green support block, showing that buyers have stepped in here many times during prior corrections.
The chart’s RSI also provides an interesting signal. Despite price making lower lows, the RSI formed a rising trendline from early November into the current readings. This creates a mild bullish divergence, which usually appears near the end of larger corrective waves. It suggests momentum may already be stabilizing even though price has not yet found its final floor.
Bitcoin’s Chart Matches the Same Timing
Casi believes XRP cannot complete its bottom alone. Her view is that both Bitcoin and XRP are moving in synchronized macro structures. Bitcoin came close to its own macro .382 retracement but still has a little room left to touch the $80,000 area.
Her model expects:
- XRP to hit $1.65
- BTC to hit $80,000
- Both moves happening almost simultaneously
She argues that once these levels are reached, Bitcoin begins its Wave 5 into new highs while XRP begins its Macro Wave 3; the strongest part of an Elliott Wave cycle.
Read also: Here’s the XRP ETFs Status Update – The Real Facts
The Bottom May Be Close, but Not Confirmed Yet
The message is clear: XRP still likely needs one more push lower before a real reversal can begin. Both charts and momentum indicators suggest the correction is mature, yet not technically complete.
If XRP does reach $1.65 while Bitcoin completes the move to $80,000, the reaction at those levels will be the key moment to watch. A strong rebound there would signal the start of the next major bullish phase for both assets.
Subscribe to our YouTube channel for daily crypto updates, market insights, and expert analysis.