
Ripple’s XRP is kicking off the new week with a mix of excitement and confusion after one of its biggest catalysts finally went live. The first U.S. spot XRP ETF, the Canary XRPC fund, launched on Nasdaq and pulled in more than $243 million in net inflows within just two trading days.
But despite that strong start, the XRP price didn’t rally. Instead, the price dropped about 9%, sliding to around $2.21 as broader market sentiment weakened.
At the same time, institutional activity around XRP continues to build. Evernorth Holdings filed to go public with a $1 billion XRP treasury, aiming to open the door for regulated XRP yield products and tokenized-finance tools.
On-chain data also shows roughly 149 million XRP (about $335 million) moving off exchanges into self-custody. This typically hints at accumulation, but in the short term, market momentum is still shaky.
What you'll learn 👉
What the XRP Chart Is Showing
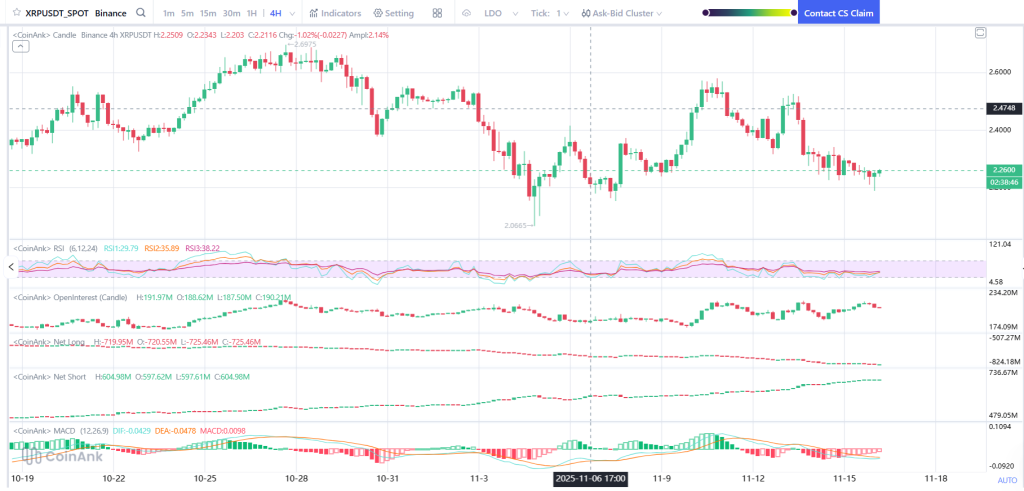
The 4H chart shows a market trying to find direction after a sharp dip. The XRP price bounced off the $2.06 zone, but every attempt to climb back above $2.47 has been rejected so far. That area has now become the major short-term ceiling.
Price is stuck between roughly $2.06 and $2.26, creating a tightening range. This kind of sideways action often appears after a big news event, in this case, the ETF launch, when traders wait for new signals before committing.
If the XRP price can reclaim the $2.33–$2.47 region with strong volume, the chart opens up for a potential recovery. If it keeps failing there, another retest of $2.06 is still very possible.
Market Indicators
Momentum indicators match the cautious tone on the chart. The RSI is sitting in the 35–40 range on the 4H timeframe, which indicates weak buying strength but also plenty of room for a bounce if momentum shifts.
Open interest hovers near $190 million, but has been slowly declining. That means traders are reducing exposure rather than adding new long positions – a common reaction after a widely expected event fails to trigger a rally.
The MACD is still below the signal line, but the histogram is beginning to level out. That’s often an early sign that momentum might be shifting, even though sellers are still in control at the moment.
Overall, the indicators show a market that hasn’t made up its mind. It’s not bearish enough to break down, but it’s also not strong enough yet to call it a clear reversal.
Read Also: Here’s Exactly Why DASH Price Is Pumping
XRP Price Short-Term Outlook for This Week
The important level to watch is $2.20. If XRP stays above that and starts building a base, the next move higher would be a push toward $2.33, then a bigger test at $2.47. A clean break above $2.47 would show that the market is finally reacting well to the ETF news.
If the XRP price falls back toward $2.06, things turn bearish again. Losing that level would put $2.00 and $1.90 on the table as next supports.
Right now, the market looks split. The fundamentals are improving thanks to the ETF, institutional interest, and massive exchange outflows, but the chart is still showing hesitation.
This week will likely come down to one thing: whether the XRP price can flip the $2.33–$2.47 zone into support and start building a real post-ETF recovery.
Subscribe to our YouTube channel for daily crypto updates, market insights, and expert analysis.