The crypto market took a massive hit on October 11. In just one day, more than $19 billion disappeared. Bitcoin dipped from around $123,000 to under $105,000 a drop of over 14%. Altcoins were also not left out in the decline, Ethereum, Solana, Cardano, XRP, and Dogecoin also plunged hard.
Sui price sank by over 80%, falling from around $3.7 to $0.5 before bouncing back. Since then, it has recovered more than 350%. Where could its price possibly go from here? That’s the focus of this article.
What you'll learn 👉
Sui Price Recovery and the Big Picture Pattern
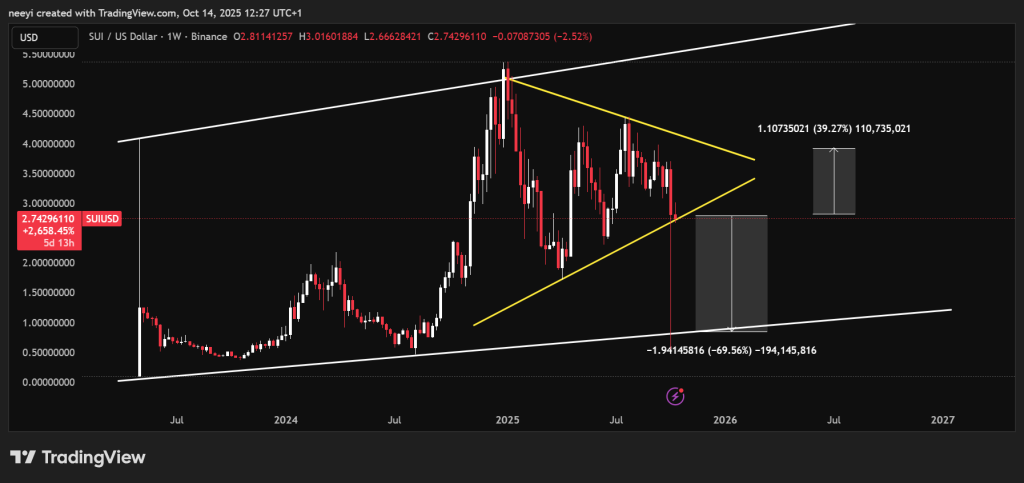
Despite the sharp crash, its overall structure is still holding up. SUI price has been moving inside an ascending channel since late 2023, showing a steady pattern of higher lows and higher highs for nearly two years.
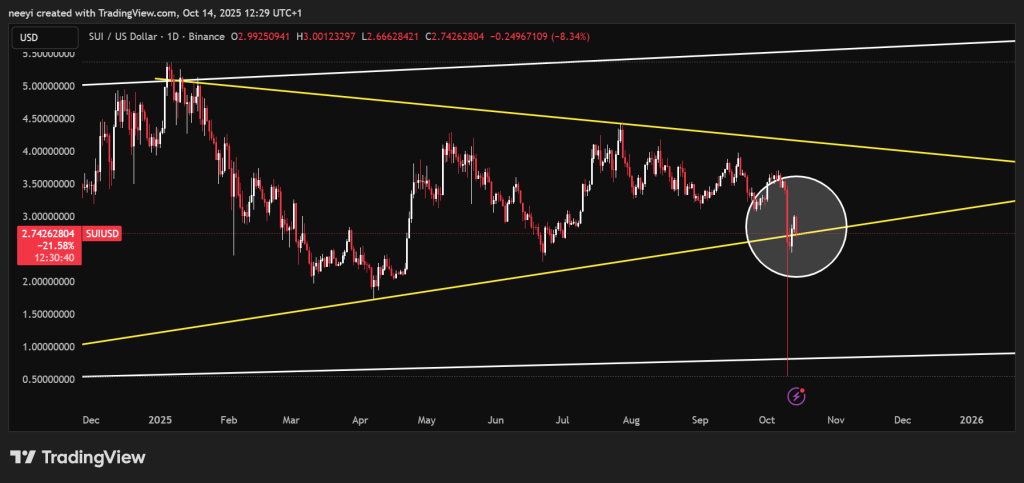
During the October crash, the price dipped sharply below the lower edge of a smaller triangle pattern that has been forming inside this channel.
That looked like a bearish breakdown at first. Yet within the same day, the bulls took control again and pushed the price back into the pattern. This reaction showed that buyers were still active even after such a massive market liquidation.
SUI Price Testing a Key Level
Right now, the SUI price is retesting the lower boundary of the triangle pattern. The movement looks like a healthy test of support rather than a breakdown. If this level holds, the price could start rising again. A successful rebound from this zone could push Sui toward the upper part of the triangle. That would mean around a 35% move from the current price near $2.7.
That level would likely be the first bullish target. It suggests the market is finding balance again, and Sui could start recovering its earlier strength after the crash.
If buyers stay active, the price might push above the triangle. Such a breakout could spark a stronger move toward the top of the larger uptrend.
From the chart, that target means about a 70% jump taking Sui close to $6. This would show that the long-term uptrend is still in control. It also means Sui is bouncing back faster than many expected after the big crash.
Possible Downside for SUI If Key Support Fails
If the price fails to hold the triangle support, Sui might slide toward the lower boundary of the long-term ascending channel. That move would represent a decline of about 30%, bringing the price closer to $1.9.
Even in that situation, the overall structure still shows an upward trend. The chart history suggests that Sui tends to find strong support at that lower boundary. Based on past movement, the price has rarely stayed below it for long.
Read Also: Analyst Predicts $1 Target for Stellar (XLM), but It’s Not That Simple
The chart action shows a market that is trying to rebuild confidence. Sui has managed to recover significantly from the crash while keeping its larger structure intact. The triangle pattern now holds the key. A rebound could open the door for another leg higher, while a breakdown could mean another retest of long-term support.
Subscribe to our YouTube channel for daily crypto updates, market insights, and expert analysis.