Dogecoin is once again gaining interest as traders start talking about a possible rally. At the moment, DOGE price is trading around $0.2539, and both the monthly and daily charts are showing setups that could pave the way for higher prices.
Two prominent analysts have shared their views on X (formerly Twitter), pointing out technical patterns that may decide where DOGE goes next.
What you'll learn 👉
The Big Cup and Handle on the DOGE Monthly Chart
Analyst Mikybull Crypto shared a DOGE chart showing what looks like a cup and handle pattern forming on the monthly timeframe. This pattern has been building ever since Dogecoin price topped out in 2021.
The larger cup stretches from the $0.05-$0.07 region up to the $0.36-$0.40 neckline. A smaller cup has taken shape this year between the mid and high teens, creating what could be the “handle.”
Many of you are not ready for what is coming for $DOGE
— Mikybull 🐂Crypto (@MikybullCrypto) October 2, 2025
Cup & handle price pattern forming
RSI Cross which signals a big rally is incoming. pic.twitter.com/XfG0RaWEi9
The key level to watch is clear: the $0.36-$0.40 zone. That zone has acted as resistance on a number of occasions, and a monthly close above it would be the kind of breakout that bulls are hoping for. If that occurs, chart math places targets in the $0.54-$0.58 region and potentially $0.65-$0.70, which aligns with the 2021 all-time high.
Support is resting in the $0.22-$0.24 area, and if that gives way, the next support level comes into play in the $0.17-$0.19 area. Additionally, the RSI is moving higher from the midline without yet being overbought, a pleasant signal that momentum is gathering.
Read Also: Top Analyst Predicts Massive October Pump for Bitcoin and Ethereum: How High Can They Go?
Daily Channel Keeps the Dogecoin Uptrend Alive
Meanwhile, analyst Stonk Chris pointed to a rising channel on the daily chart. DOGE price has been bouncing between higher lows and higher highs inside this channel for months.
The recent bounce was from the $0.21-$0.23 level, and continue the trend. Conversely, resistance at $0.28-$0.31 remains intact.
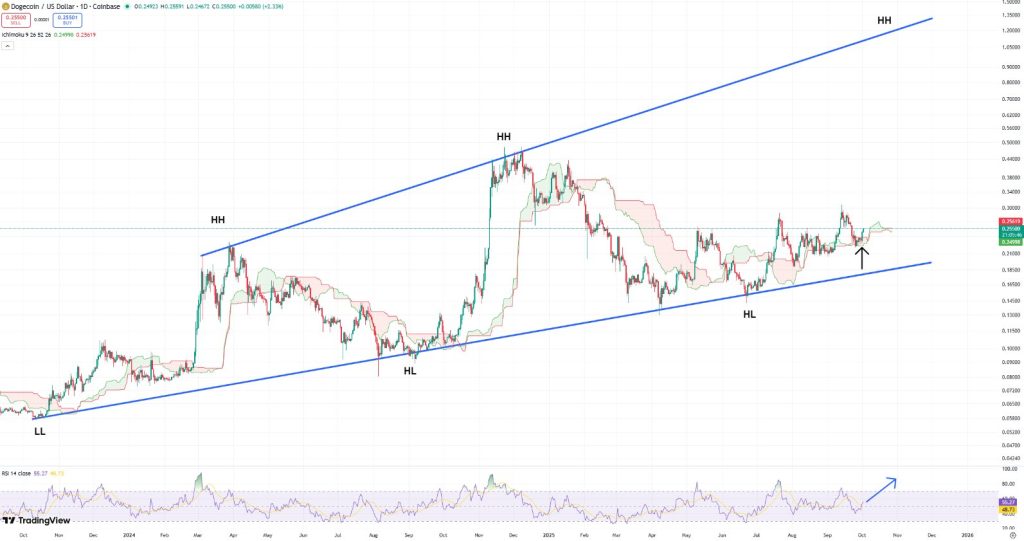
The Ichimoku cloud also indicates bulls are still in control, with Dogecoin price hovering above a thin support area. The daily RSI is climbing back up from neutral levels, which usually signals momentum is recovering.
Read Also: SEC Speeds Up ETF Path for XRP, Solana, Cardano, Litecoin, and Dogecoin – Here’s What’s Changing
What Traders Are Watching Next
The roadmap looks pretty straightforward. A daily close above $0.30 could open the door to the mid-$0.30s and then the bigger $0.40 neckline. If that neckline eventually breaks on a monthly close, the larger cup and handle pattern could be targeted for the $0.54-$0.70 zone in the long term.
For now, support to watch is $0.22-$0.24 and resistance at $0.36-$0.40. Stay above support and Dogecoin price continues its bullish shape. Break above resistance, and the stage could be set for a much larger move.
Subscribe to our YouTube channel for daily crypto updates, market insights, and expert analysis.