XRP is trading around the $3 level, but a fresh on-chain chart from Glassnode – shared by analyst Ali Martinez – shows a technical setup that could be the spark for the next big move.
The chart is a c, which maps where most XRP coins last changed hands. In simple terms, it highlights price zones packed with buy or sell activity and reveals “gaps” where very few coins were acquired. These gaps can act like air pockets on the chart, letting price move quickly when momentum kicks in.
Martinez points to a key gap between $2.51 and $2.73. Below $2.51, the histogram bars are thick, showing billions of XRP were bought and sold in that zone – strong support that absorbed selling pressure during recent pullbacks.
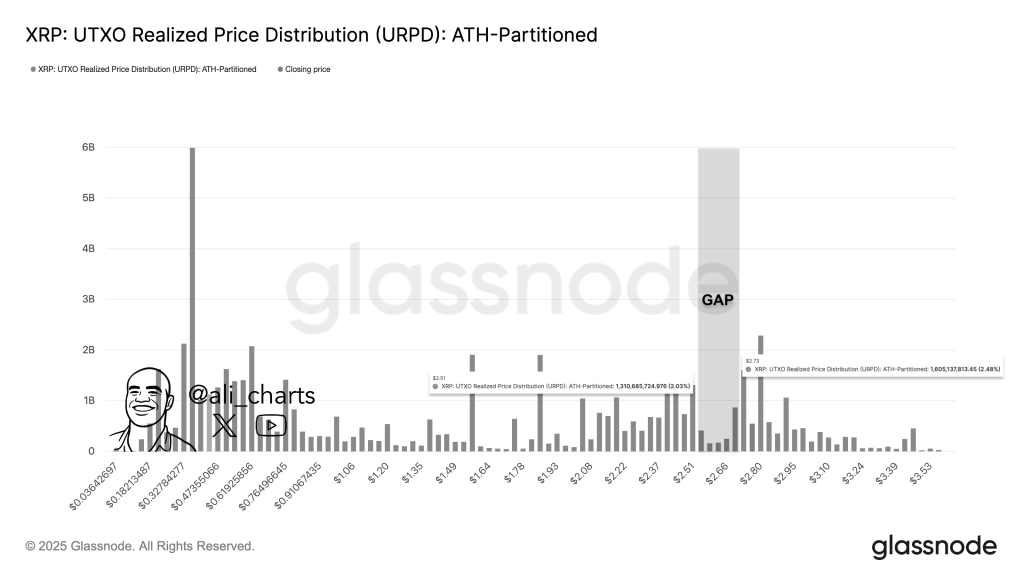
Above $2.73, the chart again lights up with heavy distribution around $2.80 and beyond. But inside the $2.51–$2.73 window there’s a striking lack of volume. That thin supply means if XRP pushes past $2.51 with conviction, it could slice through that pocket fast and retest $2.73 or even the next heavy cluster near $2.90 without much resistance.
This structure mirrors classic breakout setups. The lack of realized price in that gap tells us few traders will be looking to sell there, which often accelerates upward moves. Martinez calls a dip to that $2.51 level a potential gift, because it offers a clean springboard for bulls while keeping risk tight.
The strong base below $2.50 – where billions of XRP have changed hands – adds further confidence that even if price retests support, deep downside could be limited.
Looking ahead, XRP could first revisit the $2.51–$2.73 gap and, if buyers dominate, surge toward the $2.90–$3.10 zone and possibly the previous cycle highs above $3.20. A clean daily or weekly close above $3.20 would open the door for a new all-time high later in the year, especially if broader crypto sentiment improves.
Read also: XRP Price Prediction: XRP’s Chart Mirrors the 2017 Setup
Subscribe to our YouTube channel for daily crypto updates, market insights, and expert analysis.