When patterns repeat on a crypto chart, they act as a clue. TheCryptoBasic shared a thread on X that points to one of those clues for XRP bullish case. They quoted analyst EGRAG Crypto who maps an ascending triangle and past fractals for XRP.
That thread suggests a path that could push Ripple price toward $15 to $33 if history lines up again.
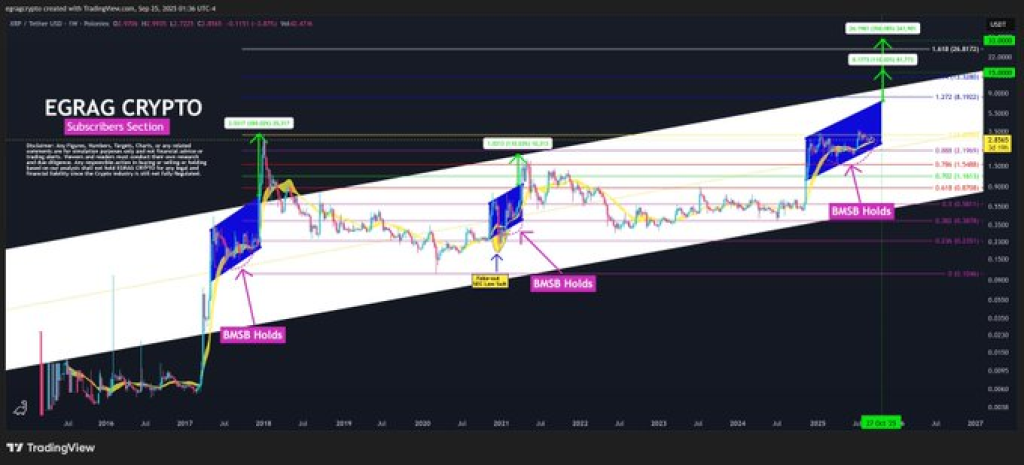
The attached chart draws a clear story. A long upward channel frames price action across cycles. Inside that channel an ascending triangle sits over the most recent consolidation. Several blue boxes mark past runs where XRP price broke out, retested, and then climbed higher.
Purple labels mark a level called Bull Market Support Bond or BMSB, sitting around $2.7 while XRP trades near $2.75 on the chart. Green arrows point at targets that match EGRAG’s math and the percent gains derived from earlier fractals.
Each breakout on the chart pairs with a spike in volume followed by a pullback that retests the breakout area. That retest behavior is the exact sequence EGRAG points to as a repeating motif. Fibonacci retracement lines are drawn on the setup. Those levels show where previous corrections found support and where a new run might pause.
How Ripple Price Could Reach $33
According to TheCryptoBasic, EGRAG lines up two historical examples that act like a template. The 2017 fractal shows a fast surge, a consolidation that forms an ascending triangle, a breakout, a retest, and then a dramatic climb to a new all-time high.
The 2021 fractal follows a similar choreography but with smaller net gains after the retest stage. Projecting those moves from the current triangle gives two paths. Repeating the 2021 run projects roughly 110% from breakout to reach $15.
Repeating the 2017 run projects roughly 350% to reach $33. EGRAG marks November 27 as a key start point for the current cycle on the chart, using that date to measure the fractal’s progression.
The chart’s annotated breakout zones show where a confirmed breakout would likely turn former resistance into support. A clean breakout above the triangle’s upper trendline, followed by a successful retest on decent volume, is the scenario that fits the fractal thesis. The visual emphasis on those retest moments explains why the analyst focuses on pattern repeatability rather than a single candle close.
What The Bull Market Support Bond Means For XRP Token
BMSB appears on the chart as a horizontal support level that mattered in past cycles. Each labeled instance where BMSB holds shows XRP price reversing or stabilizing after a pullback. That pattern suggests BMSB functions as a structural floor for this analyst’s thesis. Holding above $2.7 keeps the triangle and associated upside math intact. Falling under that level risks invalidating the fractal as drawn.
According to the market analyst, the 2017 breakout led to a 350% surge to $3.31 while the 2021 breakout resulted in a 110% rise to $1.96. He believes XRP could take any of these paths. Notably, if XRP repeats the 2021 run, it would rise 110% from the breakout point to $15.…
— TheCryptoBasic (@thecryptobasic) September 26, 2025
EGRAG also notes a caveat drawn on the chart: the pattern has failed before during unusual market stress, for example around the SEC case against Ripple in 2020. The chart marks that event as a fakeout where pattern expectations broke down. That visual reminder explains why the analyst treats BMSB as a make or break pivot on the path to $15 or $33.
Charts do not guarantee outcomes. The image itself calls attention to alternate outcomes through channel boundaries and support lines. One alternate path sees price break down from the triangle and revisit lower support inside the larger channel. Another path shows a false breakout that quickly reverses, creating pressure on BMSB and forcing a deeper correction.
Read Also: How High Can Kaspa (KAS) Price Go in 2026 Following Smart Contracts Launch?
EGRAG’s own statistic appears on the chart: ascending channels break down 57% of the time and break up 43% of the time. That math frames a cautious view. Volume confirmation, macro market tone, and any regulatory developments all show up as variables that could push XRP price toward $15 or $33, or push it the other way.
Subscribe to our YouTube channel for daily crypto updates, market insights, and expert analysis.