Ripple’s XRP price has been pretty quiet today. The price is sitting just above $3.00, after bouncing back from a dip toward $2.90 earlier in the week.
Buyers are still stepping in whenever it approaches the lower range, but at the same time, sellers keep shutting things down around $3.20. It’s almost like the market is stuck in a tug-of-war, waiting for something big to tip the balance.
What you'll learn 👉
📊 Kaspa Daily Overview (August 24)
- Current Price: $0.0909
- 24h Change: +0.33%
- 4H RSI: 44 (neutral, leaning bearish)
- Volume: 148.8M, with predicted turnover of ~1.5B
What the XRP Chart Is Showing
If you zoom out to the 4-hour chart, the story is clear. XRP price had that strong run-up in mid-July, climbing from around $2.50 to above $3.60.
But since then, it’s been working its way back down, forming lower highs and lower lows before finally settling into this sideways range.
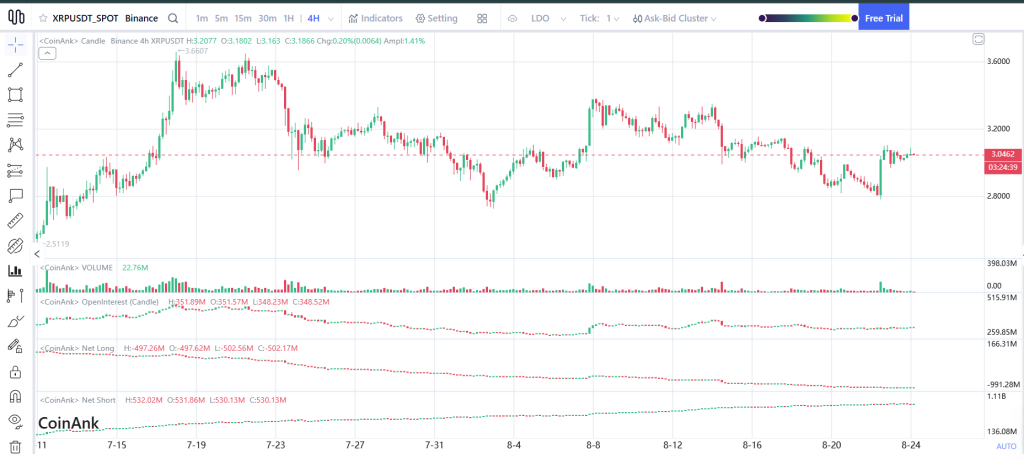
Presently, that range is defined by $2.80 on the bottom and $3.20 on the top. Buyers keep defending the $2.90–$3.00 zone, which shows there’s still confidence in that support.
On the flip side, every time XRP price gets near $3.15–$3.20, it gets rejected quickly, a clear sign that bears are protecting that resistance hard.
Looking at some of the numbers:
Volume has cooled to about 22.7M, way below what we saw during July’s breakout. That tells us most traders are waiting it out.
Open Interest is steady at around $348M, which means plenty of positions are still loaded. This can make the next move explosive once the range breaks.
Net Longs have dropped, sitting around -502M, which shows bulls are being cautious.
Net Shorts are heavy, near 530M, meaning bears are pressing their bets, but this also leaves them open to a squeeze if XRP finally breaks higher.
All in all, the chart looks like it’s coiling up for a bigger move.
Read Also: Is This Finally the Move That Will Send Chainlink (LINK) to $100?
XRP Price Scenarios for August 24
Here’s how things could play out from here:
Bullish Scenario 🚀
If XRP can finally break above $3.20 with some real volume, the next stop is likely $3.50–$3.60. And if it clears that, we could be looking at a retest of $3.66, which was the high from July. Break that, and suddenly $4.00 is back on the radar.
Neutral Scenario ⚖️
The more likely short-term outcome is more sideways action. If XRP price stays between $2.80 and $3.20, we’ll just see more chop. Traders will keep playing the range while bigger players build positions and wait for a proper breakout.
Bearish Scenario 📉
If support at $2.80 cracks, the chart flips bearish. In that case, XRP could slide down to $2.60–$2.50, which was the launch zone for July’s rally. A break below that would open the door to deeper losses.
Final Thoughts
Ripple’s XRP feels like it’s stuck in a holding pattern. The $2.80–$3.20 range has been rock solid, but it can’t last forever. Once one side gives in, we’ll likely see a sharp reaction.
If bulls take control and push through $3.20, we could see XRP price at $3.50–$3.66 before the day is over.
But if bears finally drag it below $2.80, a move back to the mid-$2.50s comes into play. For now, the best way to describe XRP is simple: quiet on the surface, but building pressure underneath.
Subscribe to our YouTube channel for daily crypto updates, market insights, and expert analysis.