XRP price is still stuck in a tight range after cooling off from its July rally. The momentum has faded, sellers are pressing harder, and the token is hanging right above a key support zone.
After peaking at $3.66 in July, XRP has pulled back and now trades around $2.86. The big question for traders today is whether that support can hold or if the market is gearing up for another leg lower.
Let’s break down what’s happening.
What you'll learn 👉
📅 What We Got Right Yesterday
In yesterday’s prediction, we talked about how important the $2.75 level is. We noted that if the XRP price slipped under it, the next stop could be $2.60 or even $2.45–$2.50.
So far, the bulls have managed to defend above $2.86, which means price is still moving in the expected range between $2.85 and $3.10. No breakout yet, and volume is still thin, which tells us the market hasn’t chosen a direction.
We also said that only a move back above $3.18-$3.25 with real volume could unlock a push toward $3.35 and maybe $3.55-$3.70. That hasn’t happened yet.
📊 XRP Daily Overview (August 22)
- Current Price: $2.86
- 24h Change: -0.54%
- RSI (14): 42.16
- Volume: Still fading
Right now, XRP price is hovering at the bottom of its range. The $2.86 level has been tested a few times, but sellers are still in control. On the flip side, $3.20-$3.30 is proving tough to break, so the price is stuck in between.
🔍 What the XRP Chart Is Telling Us
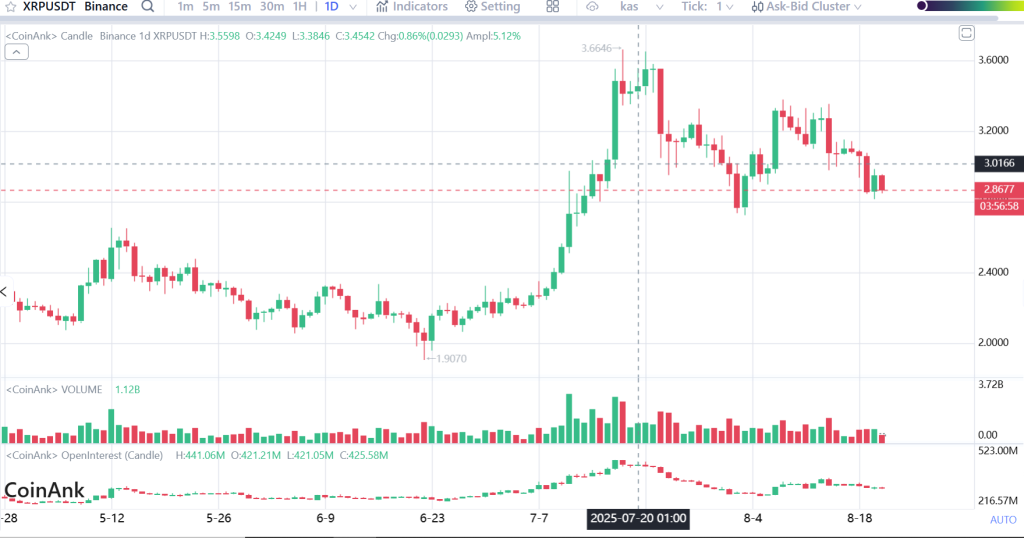
Looking at the daily chart, XRP price broke out from $2.40 in late June and then ran all the way to $3.66 in July. Since then, it’s been in correction mode.
Now the price is chopping sideways between $2.86 and $3.20. Candles are smaller, volume is lighter, and multiple rejections around $3.20–$3.30 show that sellers are defending that zone hard.

If $2.86 gives way, XRP could slide toward $2.50. But if buyers keep holding the line, we’ll likely see more sideways action.
📈 Technical Indicators (Daily Timeframe)
| Indicator | Value | Signal |
| RSI (14) | 42.169 | Weak momentum, sellers in control |
| ADX (14) | 33.031 | Strong trend, but it’s down |
| MACD (12,26) | -0.013 | Bearish crossover, pressure still on |
| CCI (14) | -151.19 | Deep in bearish territory |
| Ultimate Oscillator | 40.62 | Bears controlling across timeframes |
| Bull/Bear Power (13) | -0.250 | More selling pressure than buying |
Summary: All the signals are pointing in the same direction, bearish. Momentum is weak, the trend is strong to the downside, and sellers have the upper hand.
🔮 XRP Price Prediction Scenarios
Bullish:
If XRP price can climb above $3.18–$3.25 with volume, it could run toward $3.35 and possibly $3.55–$3.70.
Neutral:
If $2.75 holds, expect more sideways movement between $2.85 and $3.10 until something sparks a move.
Bearish:
If $2.75 breaks, XRP could head down to $2.60, with $2.45–$2.50 just below that.
🧠 Wrapping It Up
XRP price is still in a holding pattern. The $2.86 level is keeping it afloat for now, but all the indicators are flashing bearish.
Unless the bulls push back above $3.20, the most likely scenario today is more sideways action between $2.85 and $3.10. If $2.75 breaks, expect a sharper drop.
Read Also: XRP Profit-Taking Volume Is Highest in 8 Months, Data Reveals
Subscribe to our YouTube channel for daily crypto updates, market insights, and expert analysis.


