Cardano has been moving in a clear pattern for months. Since March, ADA price has been bouncing within a rising triangle. The bottom of the triangle has provided support with higher lows, while the top has formed higher highs. This has kept traders watching closely because the tighter the triangle gets, the closer it is to a breakout.
Just recently, ADA touched the top of the triangle again. It climbed above $1 but quickly dropped back by double digits to around $0.85. That sharp pullback has left many wondering what direction September could bring.
What you'll learn 👉
The Possible Paths for ADA in September
Looking at the current setup, the Cardano price still sits within its rising triangle. If this pattern holds, ADA could continue ranging between support and resistance levels for a while longer. However, the structure is narrowing, and September may be the month where a breakout finally happens.
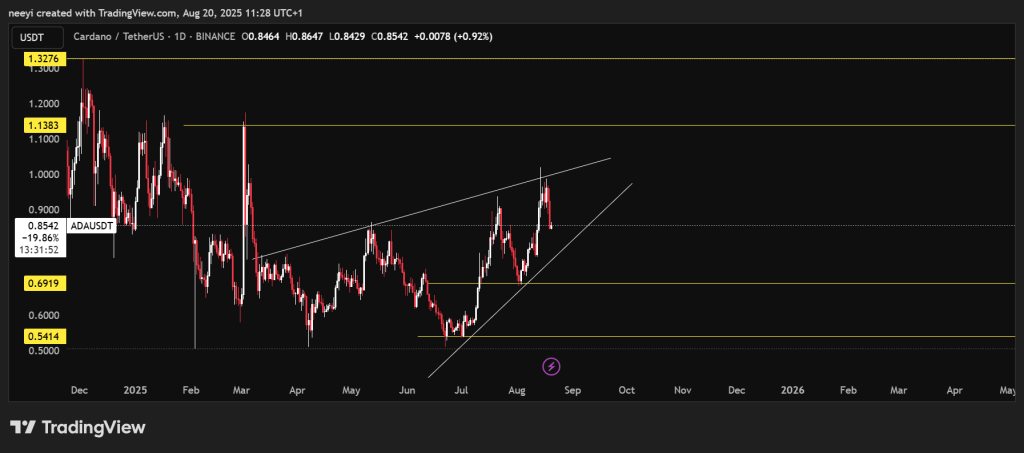
The bearish scenario would come into play if the ADA price breaks below the triangle. That could open the door to $0.60, with an extreme case taking it down to $0.54.
On the other hand, if sentiment across the crypto market turns bullish, Cardano could break out above the triangle. That move could see the ADA price push to $1.10 and possibly even $1.30, levels not seen since November 2024.
What the Technical Indicators Suggest
To get more clarity, we looked at the weekly chart readings from Investing.com. Here’s how the indicators stack up:
| Technical Indicator | Value | Signal | Explanation |
|---|---|---|---|
| RSI (14) | 56.159 | Buy | RSI is above neutral, showing momentum leans toward buyers without being overbought. |
| Stochastic (9,6) | 60.988 | Buy | Suggests ADA still has room to climb before hitting overbought conditions. |
| MACD (12,26) | 0.031 | Buy | Positive MACD signals growing bullish momentum. |
| ADX (14) | 28.22 | Buy | ADX above 25 shows a strengthening trend, favoring the upside. |
| Ultimate Oscillator | 46.222 | Sell | Slightly below neutral, hinting at short-term weakness. |
| ROC | 14.77 | Buy | Positive rate of change points to upward pressure. |
Most of the indicators lean bullish, though the Ultimate Oscillator suggests some near-term caution.
Reading the Market Verdict for ADA Price
The chart pattern and indicators together point to a market on edge. Cardano is holding inside its rising triangle, with most technical tools showing strength. If September brings a breakout, the odds tilt more toward the upside. Still, the bearish case cannot be ignored if ADA loses support around $0.85.
Cardano finds itself at an important turning point. The ADA price has respected its rising triangle for months, but September could be the month that breaks the cycle. Whether that means a rally back above $1.10 or a slip toward $0.60 depends on how the broader market mood shifts.
Read Also: Is Coinbase Finally About to List SUI? These Market Signals Suggest So
The signals lean more bullish than bearish right now, yet the pattern is clear: ADA is running out of room inside the triangle. That makes the coming weeks especially important for anyone following Cardano’s short-term price action.
Subscribe to our YouTube channel for daily crypto updates, market insights, and expert analysis.