XRP has been struggling to find its footing after last week’s drop. Sellers are still in control, keeping the price under key moving averages. The token is moving in a downtrend, and most technical indicators show that momentum is still weak.
After hitting above $3.60 in July, XRP price pulled back hard and now trades around $2.82. A small bounce from $2.77 gave bulls some relief, but the bigger trend hasn’t changed.
Let’s break down today’s setup.
What you'll learn 👉
📅 What We Got Right Yesterday
Yesterday, we talked about how $2.89 was the key level to watch. We said that if the XRP couldn’t hold above it, the price could slide toward $2.80 or lower.
That’s exactly what happened. XRP price dropped under $2.89, tapped $2.77, and then stabilized. We also mentioned that any bounce would likely struggle around $2.95–$3.00 without strong buying volume, and that’s still the case today.
📊 XRP Hourly Overview (August 3)
- Current Price: $2.83
- 24h Change: -4.44%
- 1H RSI (14): 41.23
- Volume: Low and declining
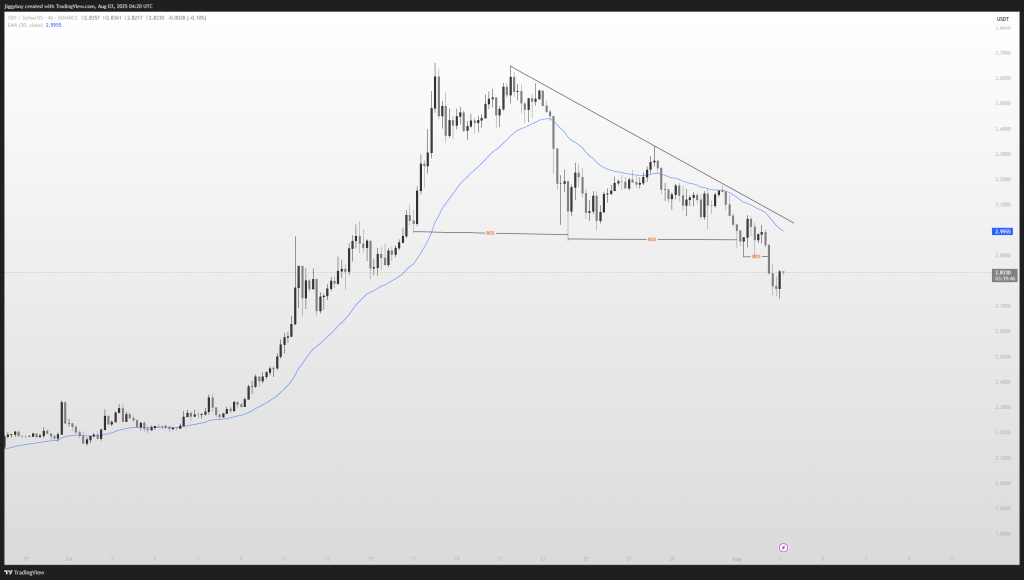
XRP price is still trading below its 30-EMA and the descending trendline. Sellers remain in charge after breaking key structure levels at $3.05 and $2.90.
The bounce off $2.77 is small compared to the larger move down. Unless XRP can push above $3.00, the market will likely keep moving sideways or even lower.
🔍 What the XRP Chart Is Showing
The 4H chart tells a clear story: lower highs and lower lows. XRP price keeps getting rejected at the descending trendline, and buyers haven’t shown enough strength to flip the trend.
Support around $2.80–$2.75 is holding for now, but if it breaks, $2.50–$2.40 is the next spot to watch. On the upside, $2.95–$3.00 is the first big hurdle, and $3.20–$3.30 comes after that.
As long as the price stays under $3.00, sellers will likely keep the upper hand.
📈 Technical Indicators (Hourly Timeframe)
| Indicator | Value | Signal / Interpretation |
|---|---|---|
| RSI (14) | 42.03 | Bearish momentum, below midline |
| MACD (12,26) | -0.035 | Bearish, weak short-term momentum |
| ADX (14) | 40.20 | Strong trend strength, confirming downtrend |
| CCI (14) | 47.78 | Neutral, market not oversold |
| ROC | -1.936 | Negative momentum persists |
| Bull/Bear Power (13) | 0.0004 | Slight bullish attempt, likely temporary |
Summary: Most indicators show bearish momentum. RSI and MACD confirm selling pressure, ADX shows the trend is strong, and there’s no clear sign of a reversal yet.
🔮 XRP Price Prediction Scenarios
Bullish Scenario:
If XRP can break above $3.00 with volume, it could run toward $3.20–$3.30. But it needs real buying power to get there.
Neutral Scenario:
If $2.80 holds, XRP price may just chop between $2.80 and $3.00 while traders wait for a trigger.
Bearish Scenario:
If $2.77 breaks, price could slide to $2.60 and maybe $2.50–$2.40 next.
🧠 Wrapping Up
XRP price is still stuck in a downtrend. Sellers are defending resistance levels, and buyers are only managing small bounces. Unless the token can clear $3.00 and that falling trendline, the market will likely keep moving sideways or drift lower.
Read Also: What Could 300,000 Onyxcoin (XCN) Tokens Be Worth by 2026?
Subscribe to our YouTube channel for daily crypto updates, market insights, and expert analysis.