XRP is showing no signs of slowing down during this ongoing market-wide pump. Over the past week, the token has surged nearly 30%, fueled by growing retail demand and strong momentum across altcoins. As of this morning, XRP is trading just shy of the $3.00 mark, hovering around $2.93 after briefly touching new local highs. So, what’s next?
Let’s break down the latest chart setup and technical indicators to get a clearer idea of where XRP could go today.
What you'll learn 👉
XRP Chart Analysis
The 4-hour chart shows a textbook breakout. XRP has clearly left its consolidation phase behind, blasting through the $2.40–$2.60 range resistance zone with aggressive volume. The price is now well above the 200-day moving average, which sits at $2.37—a level that previously acted as dynamic resistance but has now flipped into strong support.
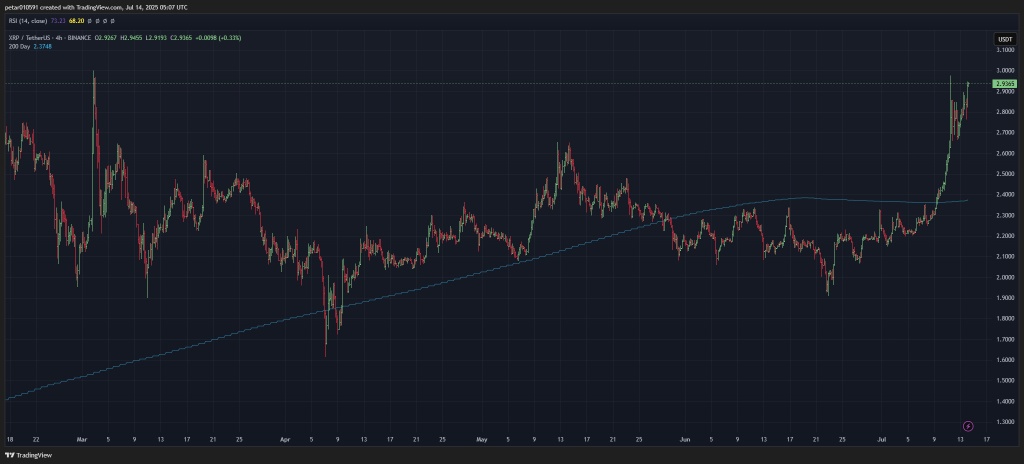
The rally appears parabolic, with very few pullbacks since July 9. Momentum is vertical, with candles stacking on top of each other, suggesting that FOMO buyers are driving this move. However, the RSI at 73.2 indicates that XRP is currently in overbought territory. That doesn’t necessarily signal a reversal, but it does suggest that a cooldown or retest could be healthy soon.
Technical Indicators (Daily Timeframe)
- MACD: 0.154 – The MACD line is well above the signal line, confirming bullish momentum.
- CCI: 165.72 – The Commodity Channel Index is deep in the overbought zone, reinforcing strong short-term strength but also the possibility of a brief correction.
- ATR: 0.1347 – Average True Range indicates elevated volatility, aligning with the recent sharp moves.
- Highs/Lows: 0.4395 – Momentum is tilted heavily toward the upside.
- Ultimate Oscillator: 61.07 – Remains in bullish territory, though not extremely high. This leaves some room for continuation.
- ROC (Rate of Change): 31.25 – A high ROC reflects explosive price movement, consistent with a breakout rally.
- Bull/Bear Power: 0.6966 – Bull power is dominant, highlighting the continued control of buyers in the current trend.
Overall, the technical indicators paint a picture of extreme bullishness with short-term risk of pullback.
Read also: XRP Just Saw Its First-Ever $1B+ Net Inflow in a Single Hour – And Korea Might Be the Reason Why
XRP Price Forecast for Today
Here’s what to expect from XRP based on current momentum and chart structure:
- Bullish Scenario: If momentum continues, XRP could retest the $3.00 psychological barrier and push toward $3.15–$3.20 by the daily close. A close above $3.00 would likely bring even more buyers into the market.
- Bearish Scenario: If overbought conditions kick in and the rally stalls, we could see a pullback to the $2.80–$2.70 area. A drop below $2.60 would be a warning sign of a deeper correction, but seems unlikely for now.
- Realistic Scenario: XRP consolidates between $2.85 and $3.00 for the rest of the day, as traders take profit and the market decides on the next leg.
The uptrend is intact, and bulls remain in control for now. However, caution is advised as markets rarely go up in a straight line for too long.
Subscribe to our YouTube channel for daily crypto updates, market insights, and expert analysis.