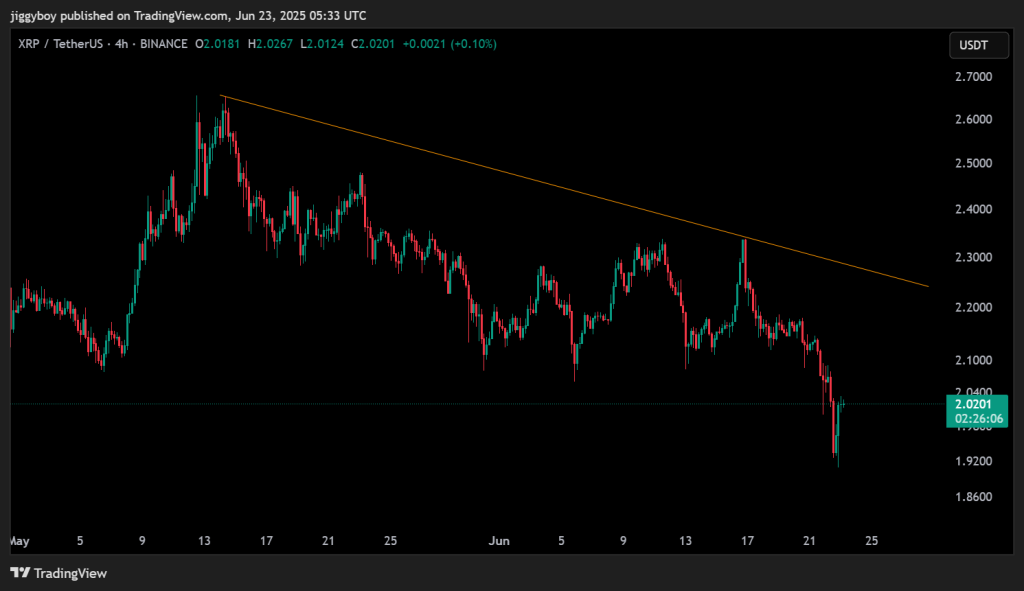
Ripple’s XRP price is trading around $2.02 after rebounding from a local low near $1.88. The move comes after a steep decline from earlier highs around $2.15, but momentum remains fragile as the token struggles to reclaim lost ground.
While the bounce has lifted XRP back above the $2.00 level, price remains well below the descending trendline that’s been capping rallies since mid-May. With no confirmed reversal and low volume behind the recovery, XRP continues to trade under bearish conditions.
Let’s take a closer look at today’s setup.
What you'll learn 👉
📊 XRP Daily Overview (June 23)
- Current Price: $2.0201
- 24h Change: – 2.38%
- 4H RSI (14): 51.63
- 24h Volume: +65.13%
XRP price is moving inside a tight range following its recovery from the $1.88 support zone. The $2.10–$2.15 area, which previously served as support, is now acting as resistance. The longer price remains under this zone, the higher the risk of a return to lower levels. The descending trendline remains untouched and currently sits around $2.30–$2.35.
🔍 What the XRP Price Chart Is Showing
XRP is in a clean downtrend, with lower highs and lower lows dominating the chart. The current rebound is missing the steam needed for a complete trend reversal.
Candlestick structure remains bearish, with sellers stepping in at every minor uptick. The $1.85–$1.88 support has remained intact so far, but constant testing could render it weaker. The absence of any kind of bullish divergence or reversal formation gives greater importance to the bearishness.
Additionally, if $1.88 breaks, the next likely support level is approximately $1.75–$1.78.
📈 Technical Indicators (Hourly Timeframe)
| Indicator | Value | Signal / Interpretation |
| RSI (14) | 51.637 | Neutral, balanced momentum |
| MACD (12,26) | -0.008 | Bearish, mild downside momentum |
| CCI (14) | 87.6567 | Short-term bullish pressure |
| Ultimate Oscillator | 62.384 | Buying strength across timeframes |
| Stochastic (9,6) | 89.433 | Overbought, risk of pullback |
| ATR (14) | 0.0237 | Low volatility, muted price action |
Summary: Indicators are mixed. MACD still shows downside pressure, while CCI and the Ultimate Oscillator point to buying interest. Stochastic warns of overbought conditions, and ATR suggests price may remain calm unless a catalyst appears.
🔮 XRP Price Prediction Scenarios
Bullish Scenario:
If XRP breaks above $2.15 with volume, a push toward $2.30 is possible. There’s no indication of this setup forming yet.
Neutral Scenario:
As long as the $1.88–$2.10 range holds, XRP price may continue to consolidate sideways between those levels.
Bearish Scenario:
A close below $1.88 would make selling more intense, with the next support being at $1.75 or even $1.60.
🧠 Wrapping Up
XRP price is still in a bear trend and can’t break its downtrend line. Although the bounce at $2.00 looks good, it lacks volume and structure.
Traders are now watching to see if the support at $1.88 will still hold. Without further bullish strength, XRP could remain range-bound or keep on falling.
Read Also: Market Analyst Spots Bullish Triangle on ONDO Price Chart – Is a $3 Breakout Coming in 2025?
Subscribe to our YouTube channel for daily crypto updates, market insights, and expert analysis.